. 2017 May 12;7(1):1852.
doi: 10.1038/s41598-017-01976-x.

Fine-tune regulation of carboxypeptidase N1 controls vascular patterning during zebrafish development

Affiliations

Fine-tune regulation of carboxypeptidase N1 controls vascular patterning during zebrafish development

Ting-Yun Wu et al. Sci Rep. .

Abstract

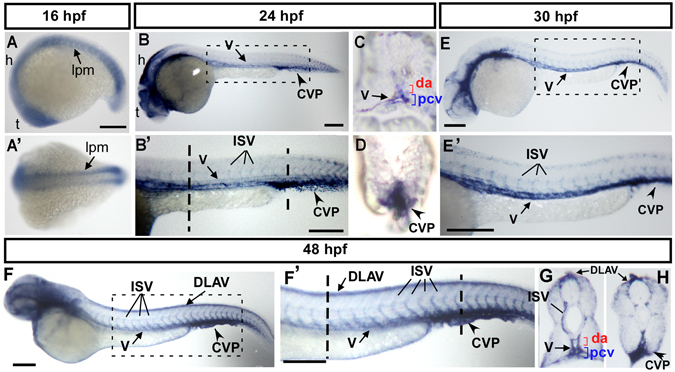
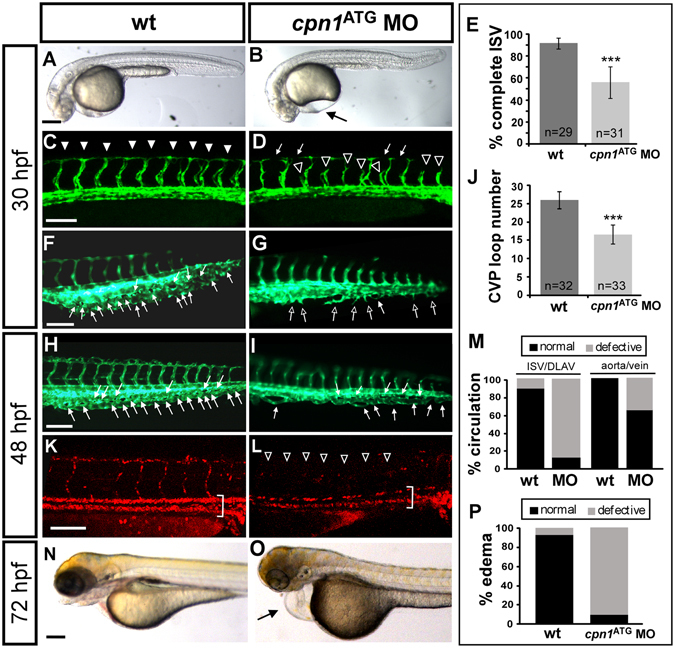
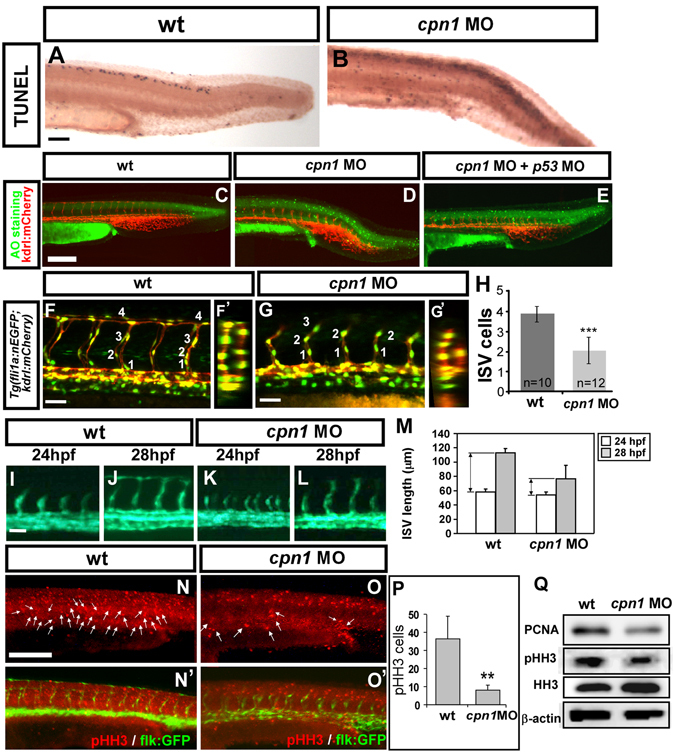
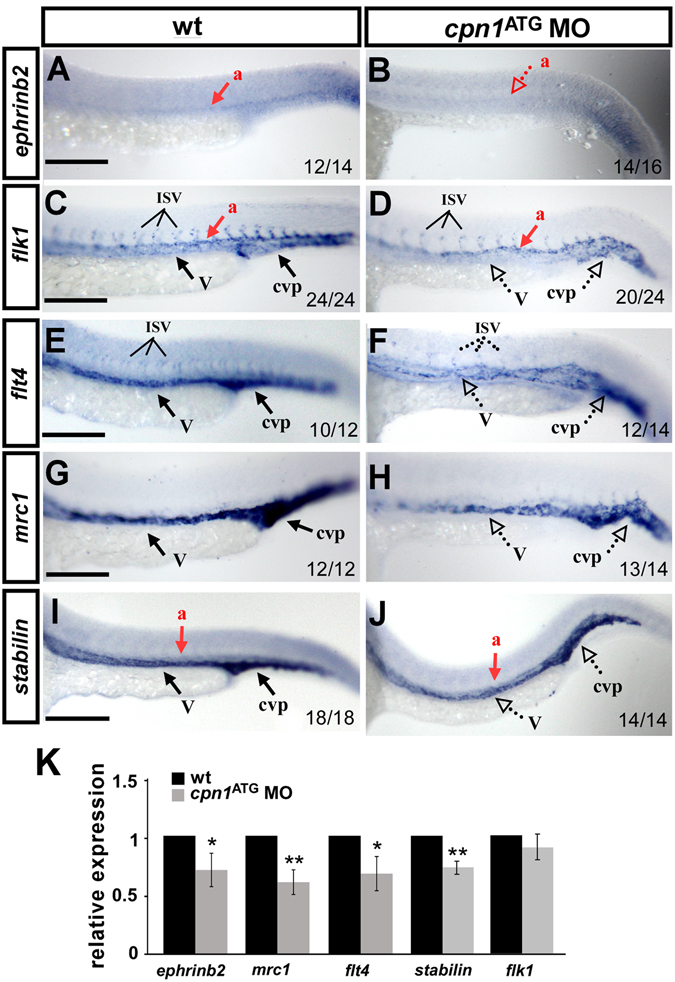
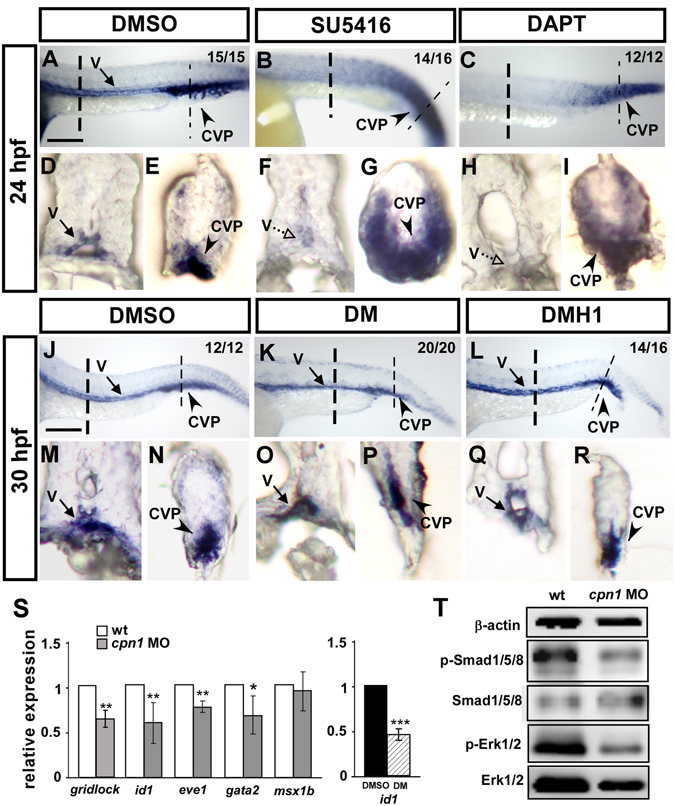
Vascular development is regulated by complicated signals and molecules in vertebrates. In this study, we characterized a novel function of carboxypeptidase N1 (Cpn1) in the vasculature. We show that cpn1 mRNA is expressed in developing vessels. The knockdown of cpn1 by morpholino injection impairs the growth of intersegmental vessels (ISV) and caudal vein plexus (CVP), suggesting the role of cpn1 in vascular development. We showed that vascular defects are not caused by cell death but are due to the impairment of migration and proliferation. Consistent with vascular growth defects, loss of cpn1 affects the expression of the vascular markers flt4, mrc1, flk, stabilin, and ephrinb2. Furthermore, the overexpression of cpn1 impaired the growth of ISV and CVP, but the remodeling expression of vascular markers was different from the knockdown of cpn1, indicating the differential regulation mechanisms in cpn1-overexpressing embryos. We examine the interaction between cpn1 and multiple signals and observed that cpn1 is regulated by Notch/VEGF signals for ISV growth and likely regulates BMP signals for CVP patterning. In conclusion, we demonstrate that cpn1 has a critical role in the vascular development of zebrafish. We also reveal a fine-tune regulation of cpn1 that controls vascular patterning mediated by multiple signals.


Conflict of interest statement

The authors declare that they have no competing interests.

Figures

Figure 1
Figure 1
Spatiotemporal expression of cpn1 during zebrafish development. (A) The lateral view shows cpn1 mRNA expression at the 18 S stage in the lateral plate mesoderm (l pm), hindbrain (h), and telencephalon (t). (A′) The dorsal view of the embryos shows cpn1 expression in the lpm. (B,B′) At 24 hpf, cpn1 was expressed in the vessels (v), intersegmental vessels (ISV) and caudal vein plexus (CVP) of the trunk. B′ is an enlargement of B. (C,D) The cross sections of embryos from B′ demonstrate that cpn1 is expressed in the dorsal aorta (da), posterior cardinal vein (pcv) and CVP. (E,E′) At 30 hpf, cpn1 was expressed in the vessels (v), ISV, and CVP of the trunk. E′ is an enlargement of E. (F,F′,G,H) At 48 hpf, cpn1 was expressed in ISVs, dorsal longitudinal anastomotic vessels (DLAV), vessels (v), da, pcv and CVP, as observed in the lateral view and transverse sections of the embryo trunk and tail regions. F′ is an enlargement of F. Scale bars in all figures represent 200 µm.
Figure 2
Figure 2
Knockdown of cpn1 causes vascular defects in zebrafish development. (A,B) The bright field images of control and cpn1 ATG morpholino (3.41 ng)-injected embryos at 30 hpf. (CJ) At 30 hpf, ISVs reached DLAV and formed a honeycomb-like structure in the caudal vein plexus (CVP) in wild-type controls by using Tg (fli1:eGFP y1) zebrafish (C,F). Compared with wild-type control (arrowheads in C, arrows in F), loss of cpn1 caused ISV growth defects (hollow arrowheads in D) and less honeycomb-like structure formation in CVP (arrows in G). At 48 hpf, less CVP loop formation (arrows in I) compared with that in control (arrows in H). (K,L) The injection of cpn1 ATG MO into Tg (fli1a:eGFP y1; gata1:dsRed sd2) embryos revealed that loss of cpn1 caused circulation defects in ISVs at 48 hpf. (N,O) At 72 hpf, cpn1 ATG morphants had pericardial edema (arrow in O). (E) The percentage of completed ISVs decreased by approximately 45% in cpn1 ATG morphants (n = 29 in wt and n = 31 in cpn1 ATG MO) at 30 hpf. (J) The loop formation in CVP exhibited a decrease in cpn1 ATG morphants (n = 32 in wt and n = 33 in cpn1 ATG MO) at 48 hpf. (M) Quantification data showed cpn1 morphants had approximately 90% defects in the ISV–DLAV circulation and 40% defects in the aorta–vein circulation compared to controls (n = 39 in control and n = 28 in cpn1 MO) at 48 hpf. (P) The percentage of pericardial edema was 90% in cpn1 ATG morphants compared with that in controls (n = 127 in controls and n = 50 in cpn1 ATG MO) at 72 hpf. These results were confirmed by three independent experiments. Data are represented as means ± S.D. ***Refers to p < 0.0001 by an unpaired Student’s t-test. The scale bar is 200 µm for A, B, N, and O, and 100 µm for C–L.
Figure 3
Figure 3
Knockdown of cpn1 impairs the growth of ISV cells. (AE) TUNEL assay and acridine orange (AO) staining was used to detect apoptotic cells in wt and cpn1 morphants. (A,B) Apoptotic cells (black dots) were observed in the dorsal region, but not in the vasculature in cpn1 morphants. (CE) Representative images of AO staining in uninjected control (C), cpn1 morphants (D) and cpn1 MO co-injected with p53 MO (E) on Tg(kdrl:mCherry)ci5 fish. Some increased apoptotic cells were observed on the skin and at the epidermis of the tail region in cpn1 MO (D), but not in the vasculature as compared to controls (C). Co-injection of cpn1 MO with p53 MO showed a reduction of apoptotic cells but still caused vascular defects in ISV and CVP (E). (F,F′,G,G′) Lateral and cross-sectional views of confocal images of Tg(kdrl:mCherry ci5; fli1a:nEGFP y7) embryos with cpn1 MO injection (G,G′) and uninjected control (F,F′) at 30hpf. (H) Quantification of the average number of cells per ISV in wt (n = 10) and cpn1 MO (n = 12) at 30 hpf. (IL) Migration assay is used to measure the difference of ISV length from 24 hpf to 28 hpf in wt control and cpn1 MO (n = 6 in wt and morphants), and quantitative results are shown in M. (N,N′,O,O′) Proliferation marker pHH3 from immunofluorescent image was counted in the trunk region beneath the neural tube and above yolk extension area, which is related to the regions of the main vessels and ISVs. (P) The number of mitotic cells (pHH3 cells) in control was 36.4 ± 12.4 (n = 8) and in cpn1 MO was 8 ± 2.9 (n = 6). (Q) Western blot analysis showed a reduced expression level of phosphor-histone H3 (pHH3) and another proliferation marker PCNA. β-actin and histone H3 serve as loading controls. Scale bars are 200 μm for (AE,N,O, N′,O′) and 50 μm for (F,G,IL). All results were performed by two independent experiments and data are represented as means ± S.D. ***Refers to p < 0.0001 and **refers to p < 0.001 by an unpaired Student’s t-test.
Figure 4
Figure 4
Knockdown of cpn1 modulates the expression of vascular markers. Compared with wild-type (wt) controls (A,C,E,G,I), cpn1 ATG morphants had decreased expression of the arterial marker ephrinb2 (B), venous markers mrc1 (H) and flt4 (F), and pan-vascular markers flk (D) and stabilin (J). dorsal aorta (a); vein (v); intersegmental vessels (ISV) and caudal vein plexus (cvp). The values on the bottom indicate the number of embryos exhibiting phenotype per total number of embryos analyzed from two independent experiments. (K) qPCR assay showed the relative expression level of ephrinb2 (0.71 ± 0.12), mrc1(0.61 ± 0.11), flt4 (0.69 ± 0.15), satbilin (0.74 ± 0.06) and flk1(0.9 ± 0.11) in cpn1 ATG morphants and in wt controls. qPCR data are represented as means ± S.D. **Refers to p < 0.01 and *refers to p < 0.05 according to the unpaired Student’s t-test. Scale bars are 200 µm.
Figure 5
Figure 5
Overexpression of cpn1 causes vascular defects in zebrafish embryos. (AC) The bright field images of uninjected control and cpn1 mRNA-injected (0.93ng) and (fli1:cpn1) embryos at 28 hpf. Compared with controls (arrowheads in (D), arrows in (G), the overexpression of cpn1 caused ISV growth defects (hollow arrowheads in (E, F) and less honeycomb-like structure formation in CVP at 28 hpf (H,I). At 28 hpf, ISVs reached DLAV and formed a honeycomb-like structure in CVP in controls. At 48 hpf, CVP loop formation was less (arrows in K, L) than in controls (arrows in J). (M,N) Injection of cpn1 mRNA into Tg(kdrl:mCherry ci5; fli1a:nEGFP y7) embryos (N) shows that the cell number per ISV was lower than in control (M) and ISVs did not reach DLAV as compared to control at 28hpf. (O) The percentage of completed ISVs decreased by approximately 80% in cpn1 mRNA injected embryos (n = 18 in wt and n = 28 in cpn1 mRNA) at 28 hpf. (P) The loop formation at CVP decreased in cpn1 mRNA injected samples (n = 18 in wt and n = 19 in cpn1 mRNA) at 48 hpf. (Q) The average number of cells per ISV decreased in cpn1 mRNA injected embryos (n = 8 in wt and n = 15 in cpn1 mRNA) at 30 hpf. The images are the representative pictures from two independent experiments. Quantitative data are represented as means ± S.D. ***Refers to p < 0.0001 by an unpaired Student’s t-test. Scale bars are 200 µm for A–C and 100 µm for D–N.
Figure 6
Figure 6
Inhibition of carboxypeptidase activity causes vascular defects. (A,B) Bright-field images of untreated control and embryos treated with 0.01 mg/ml protamine, a carboxypeptidase inhibitor. (CF) The protamine-treated embryos showed stalling of ISVs (D) and mispatterned CVP (F) compared with completed growth of ISV (arrowheads in C) and the sprouting or loop structure of CVP (E) in wild-type embryos at 30 hpf. (E) The quantification of complete ISVs in embryos treated with 0.01 mg/ml protamine (18 ± 7%, n = 10) and untreated controls (92 ± 3%, n = 10). The data shown is representative of two independent experiments. Data are represented as means ± S.D. ***Refers to p < 0.0001 by an unpaired Student’s t-test. Scale bars are 200 µm for A-B and 100 µm for C-F.
Figure 7
Figure 7
Interaction among cpn1, VEGF/Notch, and BMP signals. In the trunk region, the expression level of cpn1 was decreased in SU5416- (B,F) and DAPT (C,H)-treated embryos. In the tail region, the ectopic expression of cpn1 was observed in SU5416- (B,G) or DAPT-treated (C,I) embryos compared with that in DMSO-control embryos (A,D,E). (DI) Transverse sections of the embryo trunk and tail region from A, B, and C. (JR) Using DM and DMH1 to specify inactive BMP signals. In the trunk region, the expression level of cpn1 remained unchanged after DM (K,O) or DMH1 (L,R) treatment compared with that in DMSO control (J,M). In the tail region, the expression of cpn1 exhibited no differences in either DM (K,P) or DMH1 (L,R) treatment compared with that in DMSO controls (J,N). (MR) Transverse sections of the embryo trunk and tail regions from J-L. Values on the top right indicate the number of embryos exhibiting phenotype per total number of embryos analyzed from 2 indepenedent experiments. Scale bars in A-C, J-L are 200 µm. (S) Relative expression of Notch downstream target gridlock and BMP regulated targets id1, eve1, gata2 and msx1b. The expression of id1 is downregulated while the BMP signal is blocked by DM treatment compared to DMSO as a positive control. Data are represented as means ± S.D. ***Refers to p < 0.001, **refers to p < 0.01 and *refers to p < 0.05 by an unpaired Student’s t-test. (T) Western blot analysis from two independent experiments showed reduced phosphorylation of Smad1/5/8 and ERK1/2 in cpn1 morphants compared to control, and β-actin serves as a loading control.

References

    1. Conway EM, Collen D, Carmeliet P. Molecular mechanisms of blood vessel growth. Cardiovascular research. 2001;49:507–521. doi: 10.1016/S0008-6363(00)00281-9. - DOI - PubMed
    1. Patterson C. Torturing a blood vessel. Nat Med. 2009;15:137–138. doi: 10.1038/nm0209-137. - DOI - PubMed
    1. Adams RH, Alitalo K. Molecular regulation of angiogenesis and lymphangiogenesis. Nature reviews. Molecular cell biology. 2007;8:464–478. doi: 10.1038/nrm2183. - DOI - PubMed
    1. Childs S, Chen J-N, Garrity D, Fishman M. Patterning of angiogenesis in the zebrafish embryo. Development. 2002;129:973–982. - PubMed
    1. Lawson ND, Weinstein BM. In vivo imaging of embryonic vascular development using transgenic zebrafish. Developmental biology. 2002;248:307–318. doi: 10.1006/dbio.2002.0711. - DOI - PubMed

Publication types