. 2017 May 12;7(1):1878.
doi: 10.1038/s41598-017-01731-2.

Labeling Extracellular Vesicles for Nanoscale Flow Cytometry

Affiliations

Labeling Extracellular Vesicles for Nanoscale Flow Cytometry

Aizea Morales-Kastresana et al. Sci Rep. .

Abstract

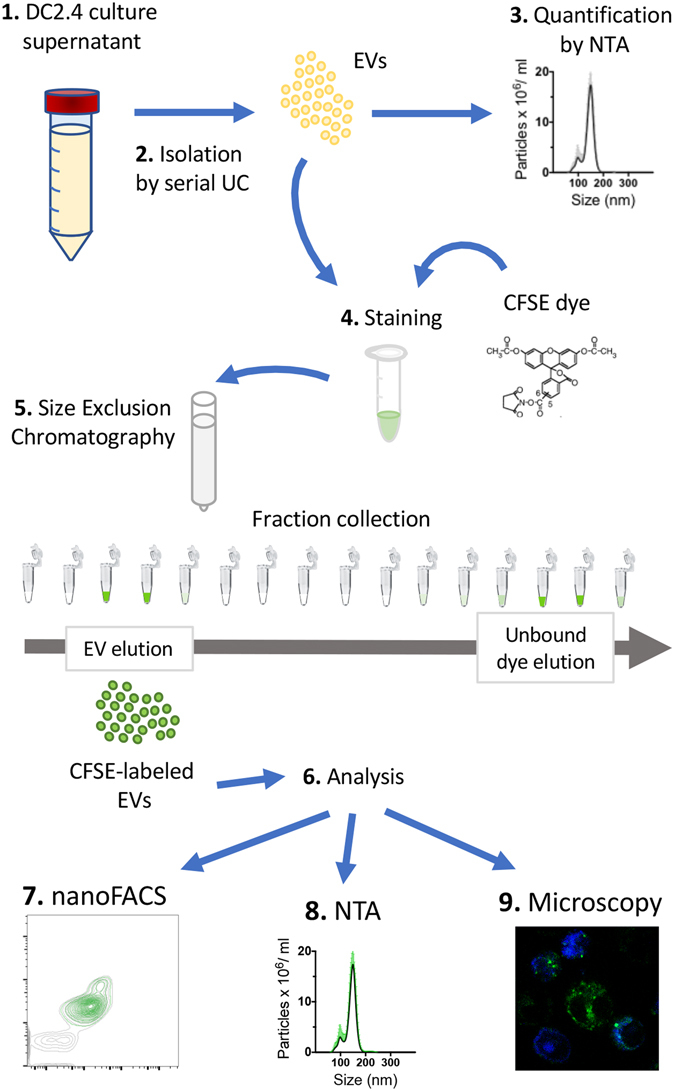
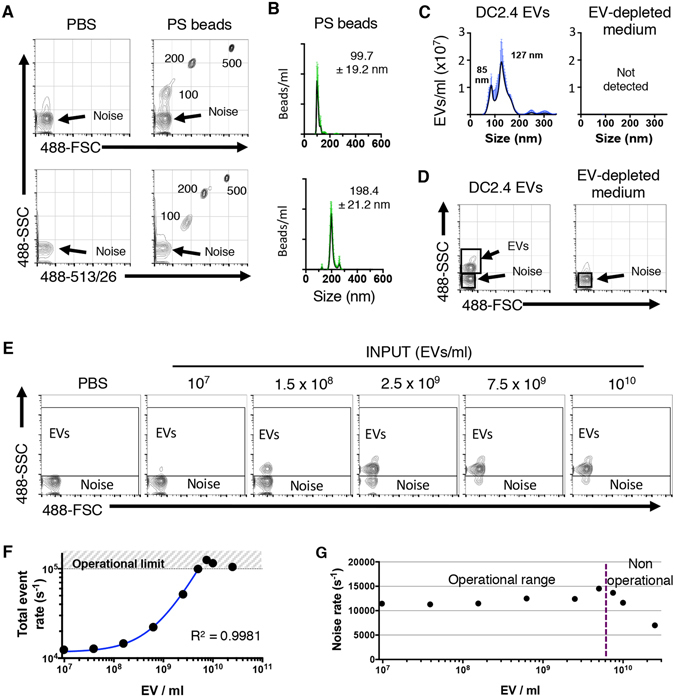
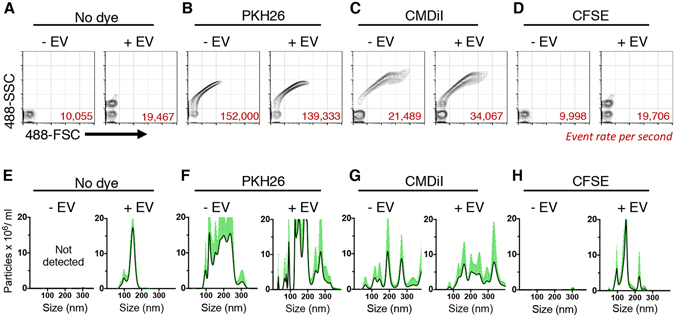
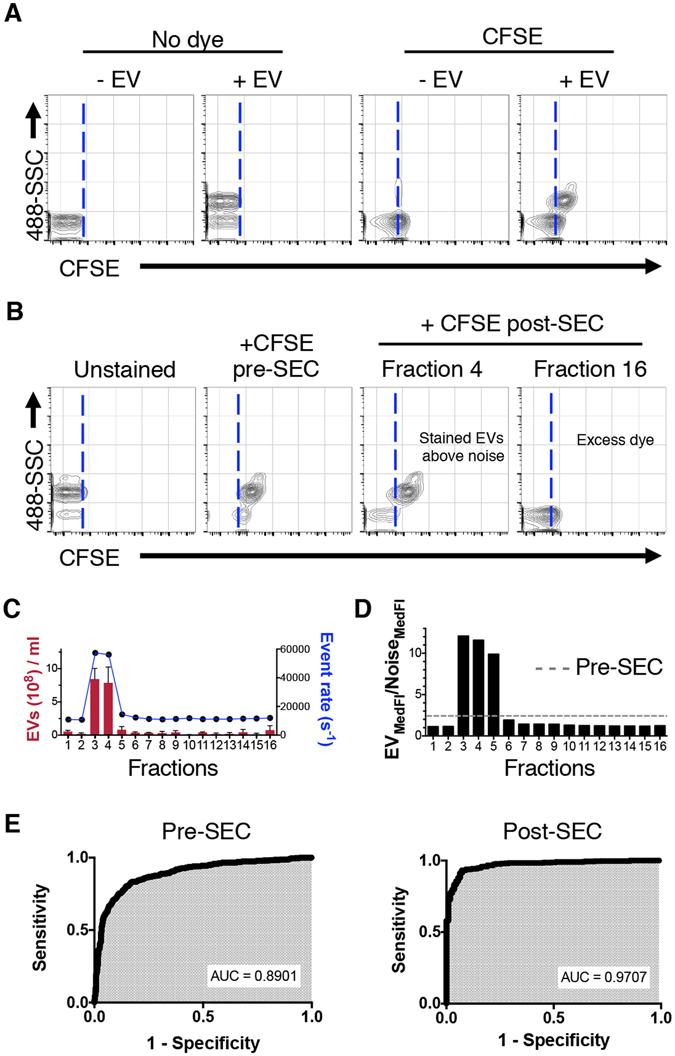
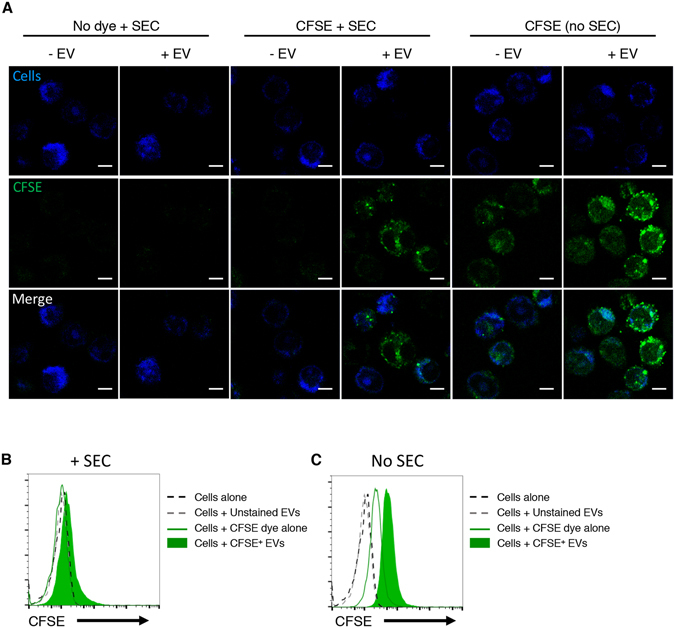
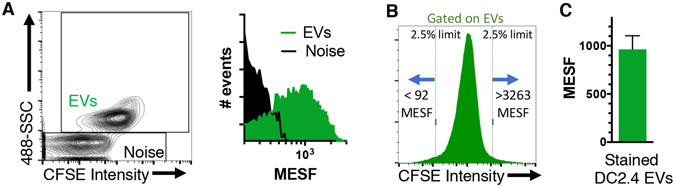
Extracellular vesicles (EVs), including exosomes and microvesicles, are 30-800 nm vesicles that are released by most cell types, as biological packages for intercellular communication. Their importance in cancer and inflammation makes EVs and their cargo promising biomarkers of disease and cell-free therapeutic agents. Emerging high-resolution cytometric methods have created a pressing need for efficient fluorescent labeling procedures to visualize and detect EVs. Suitable labels must be bright enough for one EV to be detected without the generation of label-associated artifacts. To identify a strategy that robustly labels individual EVs, we used nanoFACS, a high-resolution flow cytometric method that utilizes light scattering and fluorescence parameters along with sample enumeration, to evaluate various labels. Specifically, we compared lipid-, protein-, and RNA-based staining methods and developed a robust EV staining strategy, with the amine-reactive fluorescent label, 5-(and-6)-Carboxyfluorescein Diacetate Succinimidyl Ester, and size exclusion chromatography to remove unconjugated label. By combining nanoFACS measurements of light scattering and fluorescence, we evaluated the sensitivity and specificity of EV labeling assays in a manner that has not been described for other EV detection methods. Efficient characterization of EVs by nanoFACS paves the way towards further study of EVs and their roles in health and disease.


Conflict of interest statement

The authors declare that they have no competing interests.

Figures

Figure 1
Figure 1
Summary of the workflow for the methods described in this manuscript. DC2.4 cells were cultured in EV-depleted medium without phenol red to produce EV containing supernatants (1). Then, EVs were isolated by serial ultracentrifugation (2) and concentration and size distribution characterized by NTA (3). Afterwards, EVs were stained with CFSE (4) or other dyes (not depicted here) and free dye was washed by size exclusion chromatography (5). CFSE-labeled EVs eluted in fractions 3 and 4 were used for their analysis (6) by different methods: nanoFACS (7), NTA (8) and microscopy (9). UC, ultracentrifugation; EV, extracellular vesicle; NTA, Nanoparticle Tracking Analysis.
Figure 2
Figure 2
Submicron particle detection by nanoFACS HR-FCM. (A) Representative dot plot of PBS or 100, 200 and 500 nm polystyrene beads, analyzed by light scattering and fluorescence by nanoFACS, with background reference noise shown in the lower left corner in each plot. The background reference noise is a random sampling of scattered light from laser:stream intercept. (B) Size distribution of 100 and 200 nm polystyrene beads and (C) DC2.4-derived EVs (left) or control sample from EV-depleted medium subjected to same isolation procedure (right) by NTA. (D) DC2.4 EV detection by light scattering in nanoFACS, clearly resolved above the background reference noise. (E) Serially diluted DC2.4 EV analisis by nanoFACS to assess the suitable operational range that avoids coincident detection of particles. The relative percentage of noise and EVs particles changes as the EV concentration increases, but the light scattering pattern doesn’t change. (F) Quantification of the total event rate in E. Dotted line depicts the limit of the operational range. The curve fit was calculated by nonlinear regression excluding the three most concentrated EV preparations. (G) Noise rate is stable in the operational range, but drops when sample concentration is above the operational range (gate strategy shown in E). Representative data from multiple independent experiments with similar results. NTA histograms represent the mean of three independent acquisitions ± SD in green. The numbers on the NTA graphs indicate the mode value of the size. EV, extracellular vesicle; Noise, background reference noise; FSC, forward and SSC, side light scatter; NTA, Nanoparticle Tracking Analyses; SD, standard deviation.
Figure 3
Figure 3
EV label suitability analysis by nanoFACS HR-FCM and NTA. nanoFACS analysis of light scattering pattern and event rate (A–D), and assessment of concentration and size distribution by NTA (E–H) of the following samples: PBS control and unstained EVs diluted in PBS (A,E), PKH26 alone in PBS or in the presence of EVs (B,F), CM-DiI alone in PBS or with EVs (C,G) and CFSE alone in PBS or with EVs (D,H). Side by side comparisson between PBS control and dye alone was used to interrogate the non-specific formation of micelles or other forms of dye aggregation. All the samples were stained and tested on the same day, under the same nanoFACS and NTA setup conditions to avoid interexperimental variations. Representative data from three independent experiments is shown. NTA histograms represent the mean of three replicate meassurements of the same sample and SD in green. EV, extracellular vesicle; FSC, forward and SSC, side light scatter; NTA, Nanoparticle Tracking Analyses.
Figure 4
Figure 4
Size exclusion chromatography removal of unbound dye increases the signal to noise ratio of CFSE-labeled EVs. (A) Representative plots of fluorescence detection on unstained EVs, CFSE-labeled EVs and EV-lacking controls, analyzed by nanoFACS. Note a shift on the background reference noise fluorescence, due to the presence of free fluorescent CFSE dye in the sample, . (B) Representative dot plots depicting 488-SSC and CFSE fluorescence showing unstained and CFSE-stained EVs before and after size exclusion chromatography. Dotted lines in A and B separate the CFSE- and CFSE+ events, and were set on the limit of the background reference noise population in the unstained EV plot. (C) EV concentration analysis by NTA (in red) and total event rate by nanoFACS (in blue) of each fraction collected after size exclusion chromatography. NTA data shows the mean of three acquisitions and SD. (D) Ratio between EV and background reference noise median fluorescence intensity after eluting from size exclusion column (gated as in Fig. 2E). Dashed line shows the ratio before chromatography. Analysis of size exclusion chromatography fractions was performed twice with similar results. (E) ROC curves to assess specificity and sensitivity of EV identification by fluorescence. EV, extracellular vesicle; FSC, forward and SSC, side light scatter; MedFI, Median Fluorescence Intensity. SEC, size exclusion chromatography; ROC, Receiver Operating Characteristic; AUC, Area Under the Curve; FSC, forward scatter; SSC, side scatter.
Figure 5
Figure 5
DC2.4 dendritic cells uptake CFSE-labeled EVs. (A) Confocal microscopy experiment showing that DC2.4 cells (in blue, stained with Cell Trace Far Red dye) uptake DC2.4 EVs labeled with CFSE (in green) following the staining and size exclusion chromatography method. After size exclusion chromatography, only cells incubated with CFSE labeled EVs are green. In the absence of size exclusion chromatography, cells are fluorescent regardless of the presence of EVs, indicating that unbound dye is the major contributor to the cell staining. Representative images of 5 analyzed fields are shown. All images were scaled in the same way. Scale bar = 5 µm. The experiment was repeated twice with similar results. (B) and (C) Fluorescence analysis by flow cytometry of cells shown in A, with (B) and without (C) size exclusion chromatography after EV labeling. The experiment was repeated three times, with similar results. EV, extracellular vesicle; SEC, size exclusion chromatography.
Figure 6
Figure 6
Fluorescence quantification of CFSE molecules on labeled EVs. (A) Background reference noise and EV fluorescence intensity transformed into a MESF histogram, see Supplementary Figure 6 for additional analysis. (B) Fluorescence detection range of the 95% of total EVs and (C) average MESF + SEM of EVs stained with CFSE, from four independent experiments. MESF, Molecules of Equivalent Soluble Fluorochrome.

Similar articles

Cited by

References

    1. Colombo M, Raposo G, Thery C. Biogenesis, secretion, and intercellular interactions of exosomes and other extracellular vesicles. Annu Rev Cell Dev Biol. 2014;30:255–289. doi: 10.1146/annurev-cellbio-101512-122326. - DOI - PubMed
    1. Thery C, Ostrowski M, Segura E. Membrane vesicles as conveyors of immune responses. Nat Rev Immunol. 2009;9:581–593. doi: 10.1038/nri2567. - DOI - PubMed
    1. Melo SA, et al. Glypican-1 identifies cancer exosomes and detects early pancreatic cancer. Nature. 2015;523:177–182. doi: 10.1038/nature14581. - DOI - PMC - PubMed
    1. Lasser, C., Eldh, M. & Lotvall, J. Isolation and characterization of RNA-containing exosomes. J Vis Exp, e3037, doi:10.3791/3037 (2012). - PMC - PubMed
    1. Morales-Kastresana, A. & Jones, J. C. In Exosomes and Microvesicles. Methods and Protocols Vol. 1545 (ed Andrew F. Hill) Ch. Flow Cytometric Analysis of Extracellular Vesicles, 215–225 (Springer, 2017). - PMC - PubMed

Publication types