. 2017 May 12;7(1):1838.
doi: 10.1038/s41598-017-02031-5.

Novel Algorithms for Improved Sensitivity in Non-Invasive Prenatal Testing

Affiliations

Novel Algorithms for Improved Sensitivity in Non-Invasive Prenatal Testing

L F Johansson et al. Sci Rep. .

Abstract

Non-invasive prenatal testing (NIPT) of cell-free DNA in maternal plasma, which is a mixture of maternal DNA and a low percentage of fetal DNA, can detect fetal aneuploidies using massively parallel sequencing. Because of the low percentage of fetal DNA, methods with high sensitivity and precision are required. However, sequencing variation lowers sensitivity and hampers detection of trisomy samples. Therefore, we have developed three algorithms to improve sensitivity and specificity: the chi-squared-based variation reduction (χ2VR), the regression-based Z-score (RBZ) and the Match QC score. The χ2VR reduces variability in sequence read counts per chromosome between samples, the RBZ allows for more precise trisomy prediction, and the Match QC score shows if the control group used is representative for a specific sample. We compared the performance of χ2VR to that of existing variation reduction algorithms (peak and GC correction) and that of RBZ to trisomy prediction algorithms (standard Z-score, normalized chromosome value and median-absolute-deviation-based Z-score). χ2VR and the RBZ both reduce variability more than existing methods, and thereby increase the sensitivity of the NIPT analysis. We found the optimal combination of algorithms was to use both GC correction and χ2VR for pre-processing and to use RBZ as the trisomy prediction method.


Conflict of interest statement

The authors declare that they have no competing interests.

Figures
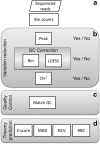
Figure 1
Figure 1
Flowchart showing the analysis steps. (a) First, sequenced reads are aligned, partitioned into 50,000 bp bins and counted. These bins are the units for further analysis and data quality can be improved using zero or more variation reduction methods. (b) Peak correction removes bins showing an unusually high coverage compared with the average coverage of bins on the same chromosome. GC correction corrects for coverage differences between bins having a different GC percentage, using one of two methods: ‘bin’ or ‘LOESS’ GC-correction. The chi-squared variation reduction corrects bins showing a higher variation in read counts between samples than expected by chance. Analysis is performed based on (corrected) read counts. (c) The Match QC indicates whether a control-group is informative for the analyzed sample. (d) Various algorithms (standard Z-score, MAD-based Z-score, Normalized Chromosome Value and Regression-based Z-score) are used for predicting trisomy.
Figure 2
Figure 2
Effect of peak correction on the CV of control samples. The effect is shown for SOLiD (white) and Illumina data (black) with no other correction, for data that also had a chi-squared correction, or LOESS GC correction, or both LOESS GC and chi-squared correction. For each type of correction the CV of four prediction algorithms (standard Z-score, MAD-based Z-score, Normalized Chromosome Value and regression-based Z-score) are shown for (a) chromosome 13, (b) chromosome 18 and (c) chromosome 21. not peak corrected; *peak corrected.
Figure 3
Figure 3
Comparison of the effect of two GC correction methods (bin GC correction and LOESS GC correction) on the CV of the control samples. SOLiD data (white) and Illumina data (black). For each type of correction the CVs of four prediction algorithms (standard Z-score, MAD-based Z-score, Normalized Chromosome Value and regression-based Z-score) are shown for (a) chromosome 13, (b) chromosome 18 and (c) chromosome 21. #Chi-squared corrected; not corrected; *peak corrected.
Figure 4
Figure 4
Effect of chi-squared-based variation reduction on the CV of control samples. SOLiD (white) and Illumina data (black) with no other correction, or with a peak correction, or LOESS GC correction or both LOESS GC and peak correction. For each type of correction the CVs of four prediction algorithms (standard Z-score, MAD-based Z-score, Normalized Chromosome Value and regression-based Z-score) are shown for (a) chromosome 13, (b) chromosome 18 and (c) chromosome 21. not chi-squared corrected; #chi-squared corrected.
Figure 5
Figure 5
Effect of the different prediction algorithms on the CV of control samples. SOLiD data (white) and Illumina data (black). Results from the four different prediction algorithms (standard Z-score, MAD-based Z-score, Normalized Chromosome Value and regression-based Z-score) are shown for (a) chromosome 13, (b) chromosome 18 and (c) chromosome 21. Variation was not reduced, #chi-squared corrected, “ LOESS GC corrected, #” both LOESS GC and chi-squared corrected before prediction.
Figure 6
Figure 6
Z-scores for three trisomies using different combinations of variation reduction and prediction algorithms. All three examples are based on SOLiD data. Results from the four different prediction algorithms (standard Z-score, MAD-based Z-score, Normalized Chromosome Value, and regression-based Z-score), in combination with uncorrected, chi-squared corrected, LOESS GC corrected, and both LOESS GC and chi-squared corrected are shown for (a) chromosome 13, (b) chromosome 18 and (c) chromosome 21.
Figure 7
Figure 7
Match QC scores and Z-scores for matching and non-matching samples. (a) Match QC scores per sample for uncorrected, chi-squared corrected, LOESS GC corrected and both LOESS GC and chi-squared corrected data for the control group, matching samples, and non-matching samples. Chromosome 21 Z-scores for (b) uncorrected data, (c) chi-squared corrected data, (d) LOESS GC corrected data and (e) both LOESS GC and chi-squared corrected data. + and black line, control group samples; ^ and green line, samples that underwent the same sample preparation procedure; ~ and red line, single centrifugation plasma samples.

References

    1. Lo YMD, et al. Early report. Presence of fetal DNA in maternal plasma and serum. Lancet. 1997;350:485–487. doi: 10.1016/S0140-6736(97)02174-0. - DOI - PubMed
    1. Alfirevic Z, Mujezinovic F, Sundberg K. Amniocentesis and chorionic villus sampling for prenatal diagnosis. Cochrane Database Syst Rev. 2003;3:CD003252. - PMC - PubMed
    1. Fan HC, Blumenfeld YJ, Chitkara U, Hudgins L, Quake SR. Noninvasive diagnosis of fetal aneuploidy by shotgun sequencing DNA from maternal blood. Proc Natl Acad Sci USA. 2008;105:16266–16271. doi: 10.1073/pnas.0808319105. - DOI - PMC - PubMed
    1. Chiu RWK, et al. Noninvasive prenatal diagnosis of fetal chromosomal aneuploidy by massively parallel genomic sequencing of DNA in maternal plasma. Proc Natl Acad Sci USA. 2008;105:20458–20463. doi: 10.1073/pnas.0810641105. - DOI - PMC - PubMed
    1. Chen EZ, et al. Noninvasive prenatal diagnosis of fetal trisomy 18 and trisomy 13 by maternal plasma DNA sequencing. PloS One. 2011;6:e21791. doi: 10.1371/journal.pone.0021791. - DOI - PMC - PubMed

Substances