. 2017 Aug;174(15):2484-2500.
doi: 10.1111/bph.13859. Epub 2017 Jun 18.

Modulation of Kv 11.1 (hERG) channels by 5-(((1H-indazol-5-yl)oxy)methyl)-N-(4-(trifluoromethoxy)phenyl)pyrimidin-2-amine (ITP-2), a novel small molecule activator

Affiliations

Modulation of Kv 11.1 (hERG) channels by 5-(((1H-indazol-5-yl)oxy)methyl)-N-(4-(trifluoromethoxy)phenyl)pyrimidin-2-amine (ITP-2), a novel small molecule activator

Harinath Sale et al. Br J Pharmacol. 2017 Aug.

Abstract

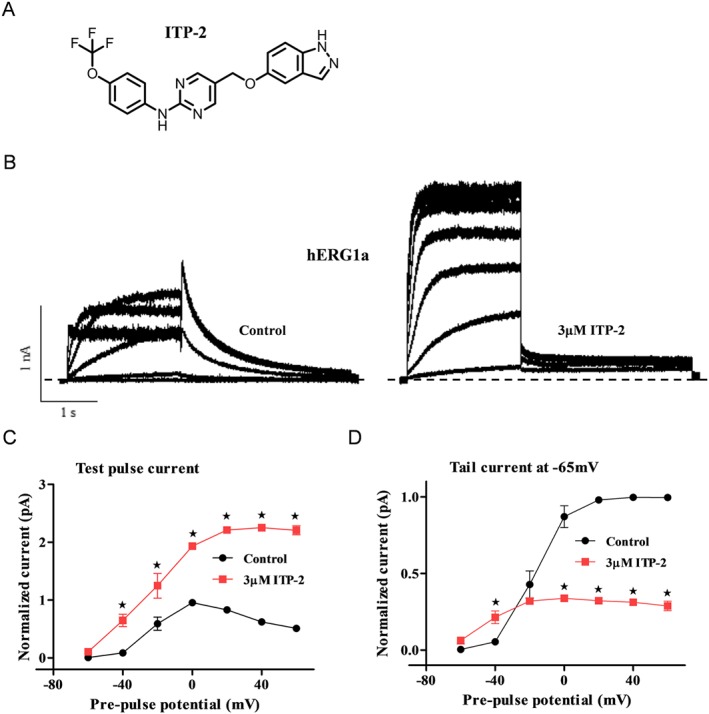
Background and purpose: Activators of Kv 11.1 (hERG) channels have potential utility in the treatment of acquired and congenital long QT (LQT) syndrome. Here, we describe a new hERG channel activator, 5-(((1H-indazol-5-yl)oxy)methyl)-N-(4-(trifluoromethoxy)phenyl)pyrimidin-2-amine (ITP-2), with a chemical structure distinct from previously reported compounds.

Experimental approach: Conventional electrophysiological methods were used to assess the effects of ITP-2 on hERG1a and hERG1a/1b channels expressed heterologously in HEK-293 cells.

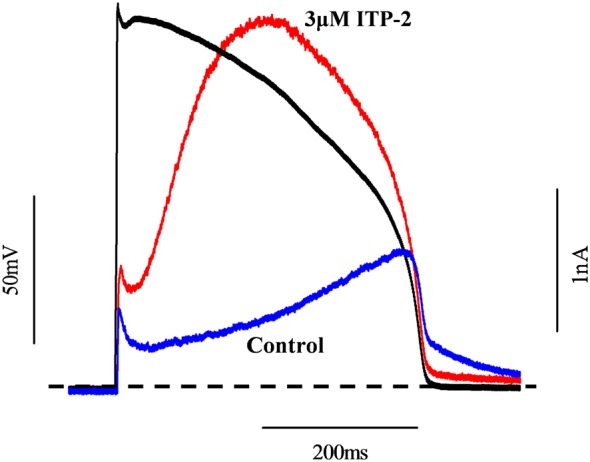
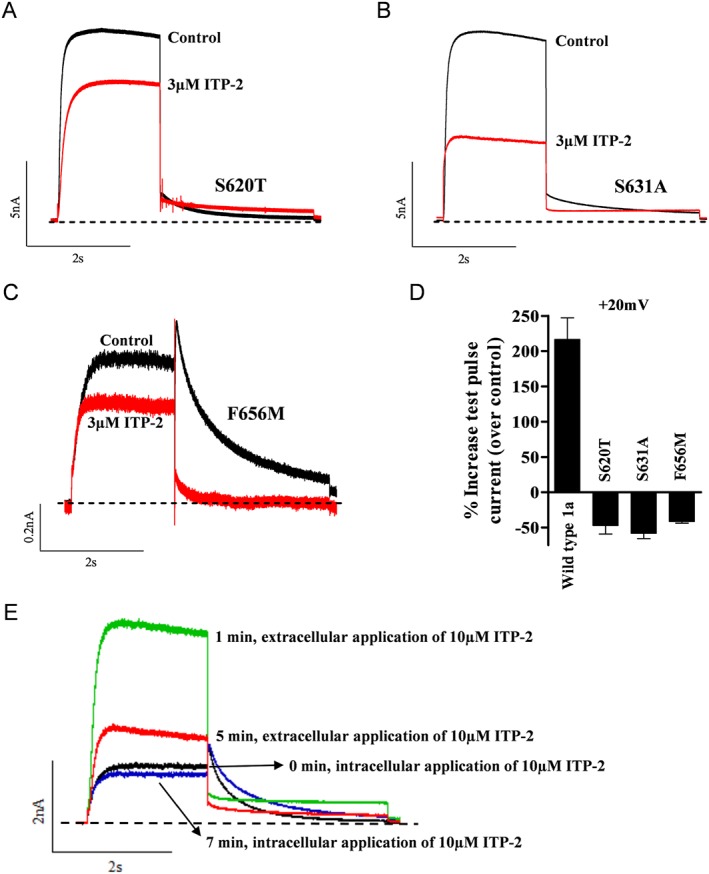
Key results: ITP-2 selectively increased test pulse currents (EC50 1.0 μM) and decreased tail currents. ITP-2 activated hERG1a homomeric channels primarily by causing large depolarizing shifts in the midpoint of voltage-dependent inactivation and hyperpolarizing shifts in the voltage-dependence of activation. In addition, ITP-2 slowed rates of inactivation and made recovery from inactivation faster. hERG1a/1b heteromeric channels showed reduced sensitivity to ITP-2 and their inactivation properties were differentially modulated. Effects on midpoint of voltage-dependent inactivation and rates of inactivation were less pronounced for hERG1a/1b channels. Effects on voltage-dependent activation and activation kinetics were not different from hERG1a channels. Interestingly, hERG1b channels were inhibited by ITP-2. Inactivation-impairing mutations abolished activation by ITP-2 and led to inhibition of hERG channels. ITP-2 exerted agonistic effect from extracellular side of the membrane and could activate one of the arrhythmia-associated trafficking-deficient LQT2 mutants.

Conclusions and implications: ITP-2 may serve as another novel lead molecule for designing robust activators of hERG channels. hERG1a/1b gating kinetics were differentially modulated by ITP-2 leading to altered sensitivity. ITP-2 is capable of activating an LQT2 mutant and may be potentially useful in the development of LQT2 therapeutics.


Figures

Figure 1
Figure 1
ITP‐2 enhances hERG1a channel current in HEK‐293 cells. (A) Structure of ITP‐2. (B) Representative hERG1a current traces showing activation by ITP‐2. Whole‐cell currents were elicited with 20 mV voltage steps from −60 to +60 mV for 2 s and tail currents at −65 mV for 3 s. (C, D) Representative I‐V relationships for steady‐state currents and tail currents before and after 3 μM ITP‐2. ITP‐2 selectively increases test pulse currents. Data shown are means±SEM; n = 5 . *P < 0.05, significantly different from control; two‐way ANOVA.
Figure 2
Figure 2
Effect of ITP‐2 on reversal potential and rectification of hERG1a channels. (A) Fully activated I‐V relationships for hERG1a channels were generated from a holding potential of −80 mV with a single step to +20 mV for 2 s and then recorded tail currents in a range of voltages between −120 to +20 mV for 2 s. Currents were normalized to the peak of the outward control current. Amplitudes of currents in the presence of ITP‐2 were normalized to their matched control. Representative current traces before and after perfusion with 3 μM ITP‐2 (top). Fully activated I‐V plots showing no changes in reversal potential with ITP‐2 (n = 5; bottom). (B) Steady‐state I‐V plots revealing differences in rectification in the presence of 3 μM ITP‐2 (left). Currents at the end of each pulse were normalized to the absolute value of the extrapolated maximum tail current evoked subsequent to a pulse to +60 mV and plotted as a function of membrane potential (means±SEM; n = 5). Representative hERG1a current traces showing larger test pulse currents and decreased tail currents in the presence of 3 μM ITP‐2 (right).
Figure 3
Figure 3
Concentration‐dependent effects of ITP‐2 on hERG1a channel currents. (A) hERG1a current traces in response to increasing concentrations of ITP‐2. Membrane currents were elicited using the protocol shown in inset with an inter‐pulse interval of 20 s. ITP‐2 increases hERG1a currents over a concentration range from 0.3 to 10 μM (left). Concentration‐response relationship for ITP‐2 versus the test pulse current (right). B. ITP‐2 has dual agonistic and antagonistic effects on hERG channels. At higher concentrations (3 and 10 μM), activation is followed by a secondary blocking effect. Data shown are means±SEM; n = 5 at 0.3 and 1μM; n = 13 at 3μM; n = 8 at 10μM.
Figure 4
Figure 4
ITP‐2 modulates hERG1a channel inactivation. (A) ITP‐2 shifts voltage‐dependent inactivation to more depolarized potentials (right); data shown are means ±SEM; n = 5. Representative current traces before and after exposure to ITP‐2; for clarity, only selected sweeps are shown (left). Dashed line represents the zero current level. (B) ITP‐2 slows inactivation kinetics of hERG1a channels. Scaled inactivating currents for comparison of time course of inactivation in the absence and presence of ITP‐2 (left). Time constants for inactivation were significantly slower at various potentials tested in the presence of ITP‐2 (right). Data shown are means±SEM; n = 6. *P < 0.05, significantly different from control. (C) Plot showing recovery from inactivation is faster in the presence of ITP‐2 at two indicated voltages −60 and −50 mV (right). Data shown are means±SEM ; n = 8. *P < 0.05, significantly different from control. Scaled tail currents showing faster recovery from inactivation after exposure to ITP‐2 (left). Time constants for recovery from inactivation were obtained by fitting the initial rising phase of the tail current to a mono exponential function.
Figure 5
Figure 5
ITP‐2 effects on hERG1a channel activation and deactivation. (A) ITP‐2 causes hyperpolarizing shift in the voltage‐dependence of activation. Conductance‐voltage plots were generated by plotting the normalized peak tail currents at −120 mV against the preceding voltage steps. Data shown are means±SEM; n = 8. (B) ITP‐2 accelerates hERG1a channel activation kinetics. Normalized test pulse currents before and after exposure to ITP‐2 (left). A single exponential was used to fit the activation time course. Time constants of activation at a representative voltage (+20 mV) were plotted for comparison (right). Data shown are means±SEM; n = 15. *P < 0.05, significantly different from control. (C) Scaled tail currents showing deactivation is faster after exposure to ITP‐2 at −120 mV (left). Tail currents were fitted to double exponential functions to obtain the fast and slow time constants for deactivation. Time constants of deactivation (slow and fast component) at two representative voltages (−65 and −120 mV) were plotted for comparison (right). Data shown are means±SEM; n = 5, ‐65mV; n = 12, ‐120mV. *P < 0.05, significantly different from control.
Figure 6
Figure 6
ITP‐2 increases total potassium ions conducted by hERG1a channels during an action potential stimulus. Typical current traces before and after exposure to ITP‐2 are shown. Dashed line represents the zero current level.
Figure 7
Figure 7
hERG1a/1b channels are less sensitive to ITP‐2. (A) Family of current traces showing reduced sensitivity of hERG1a/1b channels to ITP‐2. Currents were elicited as in Figure 1A. (B, C) Corresponding current–voltage relationships for hERG1a/1b steady‐state currents and tail currents before and after 3 μM ITP‐2. ITP‐2 selectively increases test pulse currents, similar to hERG1a channels. Data shown are means±SEM; n = 5. *P < 0.05; significantly different from control; two‐way ANOVA. (D, E) Bar graphs showing reduced sensitivity of hERG1a/1b channels to ITP‐2 (nearly sixfold); n = 13 for hERG1a; n = 8 for hERG1a/1b channels and ICA‐105574 at +20 mV (nearly threefold); n = 5 for hERG1a; n = 8 for hERG1a/1b channels. *P < 0.05, significantly different from hERG1a channels.
Figure 8
Figure 8
ITP‐2 differentially modulates hERG1a/1b channel inactivation. (A) Steady‐state inactivation curves for hERG1a/1b channels before and after exposure to ITP‐2 (right). Shift in V1/2 of voltage‐dependent inactivation for hERG1a/1b channels is significantly less when compared to hERG1a. Representative current traces before and after exposure to ITP‐2, for clarity only selected sweeps are shown (left). Dashed line represents the zero current level. Data shown are means±SEM; n = 7. (B) Slowing of inactivation is less pronounced for hERG1a/1b channels (compare Figure 4B for hERG1a). Time course of inactivation was significantly slower only at +60 mV. Data shown are means±SEM; n = 5. *P < 0.05, significantly different from control. (C) Comparison of fold change in ιinactivation for hERG1a and hERG1a/1b channels. ITP‐2 has less effect on slowing of inactivation for hERG1a/1b channels. Data shown are means±SEM; n = 5, hERG1a/1b; n = 6, hERG1a. *P < 0.05, significantly different from hERG1a channels. (D) Plot showing recovery from inactivation for hERG1a/1b channels is faster in the presence of ITP‐2 (right). Data shown are means±SEM; n = 6. *P < 0.05, significantly different from control. Corresponding scaled tail currents for recovery from inactivation without and with ITP‐2 (left).
Figure 9
Figure 9
ITP‐2 effects on activation and deactivation of hERG1a/1b channels. (A) ITP‐2 causes a hyperpolarizing shift in the voltage‐dependence of activation for hERG1a/1b channels, similar to hERG1a channels. Data shown are means±SEM; n = 5. Change in V1/2 of activation for hERG1a/1b channels is not significantly different from hERG1a channels (compare Figure 5A for hERG1a). (B) ITP‐2 accelerates hERG1a/1b activation kinetics, as with hERG1a channels. Normalized test pulse currents before and after exposure to ITP‐2 (left). Time constants of activation at a representative voltage (+20 mV) were plotted for comparison (right). Data shown are means±SEM; n = 18. *P < 0.05, significantly different from control. (C) Scaled tail currents showing deactivation is faster after exposure to ITP‐2 at −120 mV, similar to hERG1a channels (left). Time constants of deactivation (slow and fast component) at two representative voltages (−65 and −120 mV) were plotted for comparison (right). Data shown are means±SEM; n = 16, ‐65 mV; n = 5, ‐120 mV. *P < 0.05, significantly different from control.
Figure 10
Figure 10
Inactivation‐impairing mutations abolish activating effects of ITP‐2. (A, B) Response of inactivation‐impairing mutations S620T and S631A to ITP‐2. ITP‐2 failed to activate and instead inhibited S620T and S631A channels. (C) Drug binding site mutant F656M was also inhibited by ITP‐2 and did not enhance activator effects. (D) Bar graph showing comparison of ITP‐2 effects on wild type hERG and mutant channels at +20 mV. Data shown are means±SEM; n = 4, S620T and S631A; n = 5, F656M. (E) Intracellular application of 10 μM ITP‐2 through the patch‐pipette resulted in a minimal block, rather than activation. Only extracellular application of ITP‐2 on the same cell led to robust activation and inhibition of hERG current.
Figure 11
Figure 11
ITP‐2 activates a trafficking‐deficient LQT2 mutant channel. (A, B) ITP‐2 and ICA‐105574 activated the LQT2 mutant G601S channel but with reduced potency. (C) ITP‐2 failed to activate the N470D LQT2 mutant channel, while ICA‐105574 could activate but again with reduced potency. (D) Bar graph showing comparison of ITP‐2 effects on wild type hERG (n = 13) and LQT2 mutant channels (n = 4) with those of ICA‐105574 (wild type, n = 5; mutantchannels, n = 4). Experiments were carried out at +20 mV.

Comment in

Similar articles

Cited by

References

    1. Abi‐Gerges N, Holkham H, Jones EMC, Pollard CE, Valentin JP, Robertson GA (2011). hERG subunit composition determines differential drug sensitivity. Br J Pharmacol 164: 419–432. - PMC - PubMed
    1. Alexander SPH, Catterall WA, Kelly E, Marrion N, Peters JA, Benson HE et al. (2015). The concise guide to PHARMACOLOGY 2015/16: Voltage‐gated ion channels. Br J Pharmacol 172: 5904–5941. - PMC - PubMed
    1. Anderson CL, Delisle BP, Anson BD, Kilby JA, Will ML, Tester DJ et al. (2006). Most LQT2 mutations reduce Kv11.1 (hERG) current by a class 2 (trafficking‐deficient) mechanism. Circulation 113: 365–373. - PubMed
    1. Casis O, Olesen SP, Sanguinetti MC (2006). Mechanism of action of a novel human ether‐a‐go‐go‐related gene channel activator. Mol Pharmacol 69: 658–665. - PubMed
    1. Crotti L, Tester DJ, White WM, Bartos DC, Insolia R, Besana A et al. (2013). Long QT syndrome–associated mutations in intrauterine fetal death. JAMA 309: 1473–1482 (Supplementary information). - PMC - PubMed

MeSH terms