. 2017 Sep 15:331:41-53.
doi: 10.1016/j.taap.2017.05.007. Epub 2017 May 10.

The expression of keratin 6 is regulated by the activation of the ERK1/2 pathway in arsenite transformed human urothelial cells

Affiliations

The expression of keratin 6 is regulated by the activation of the ERK1/2 pathway in arsenite transformed human urothelial cells

Andrea Slusser-Nore et al. Toxicol Appl Pharmacol. .

Abstract

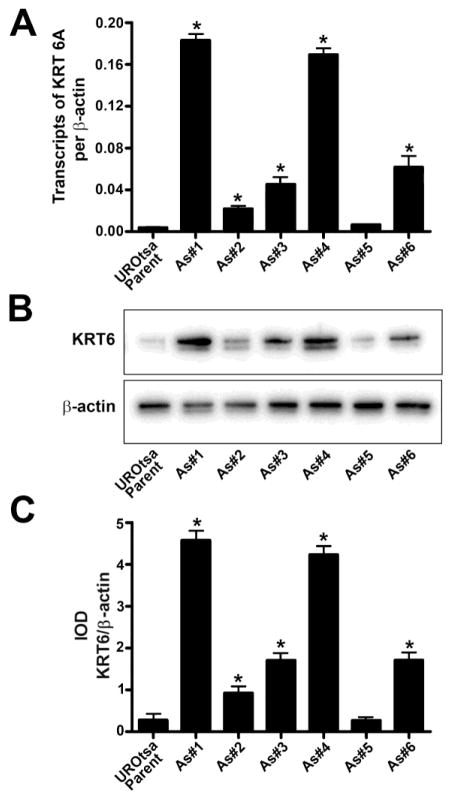
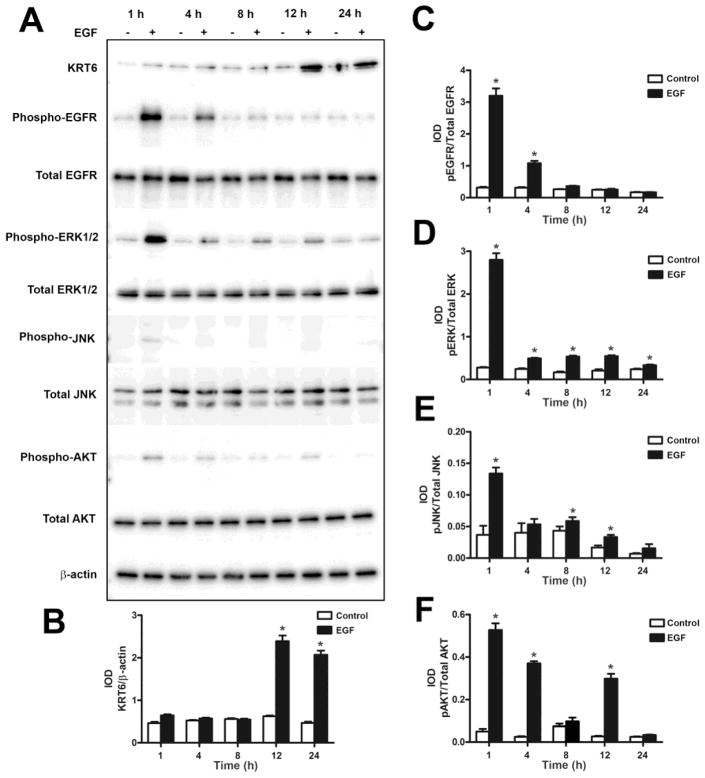
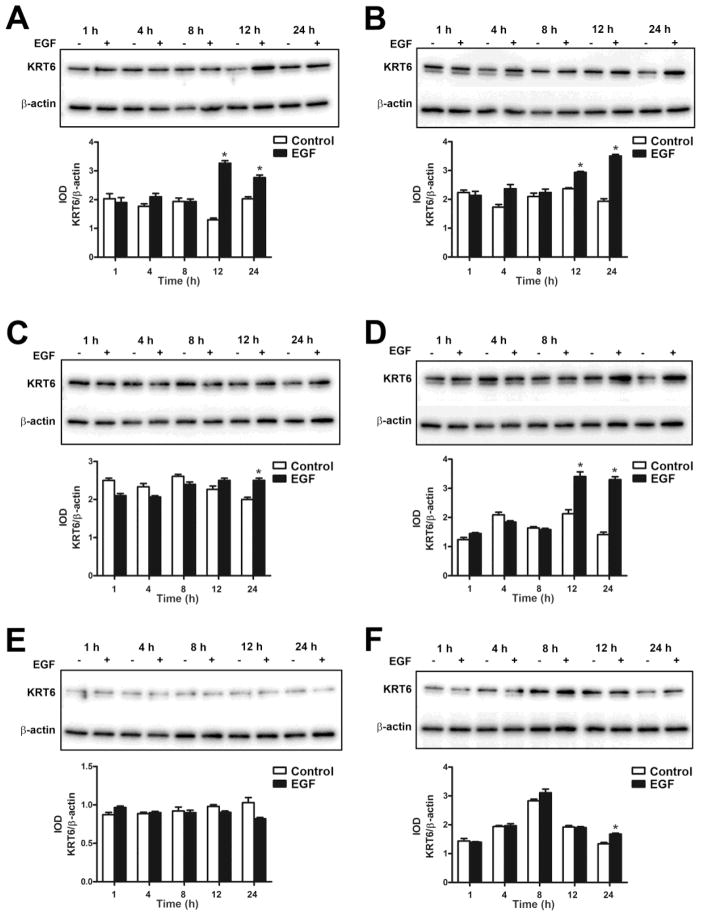
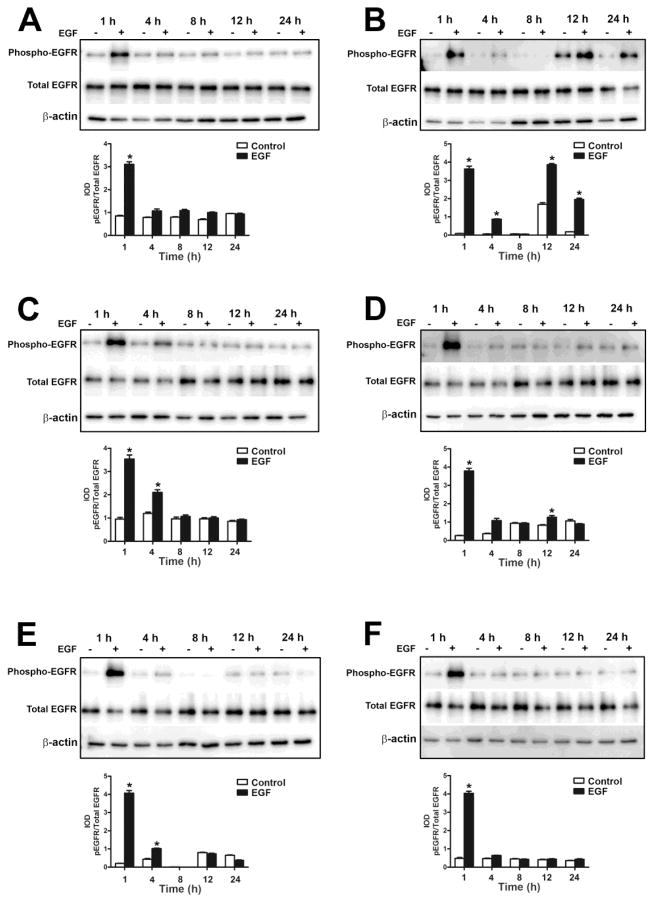
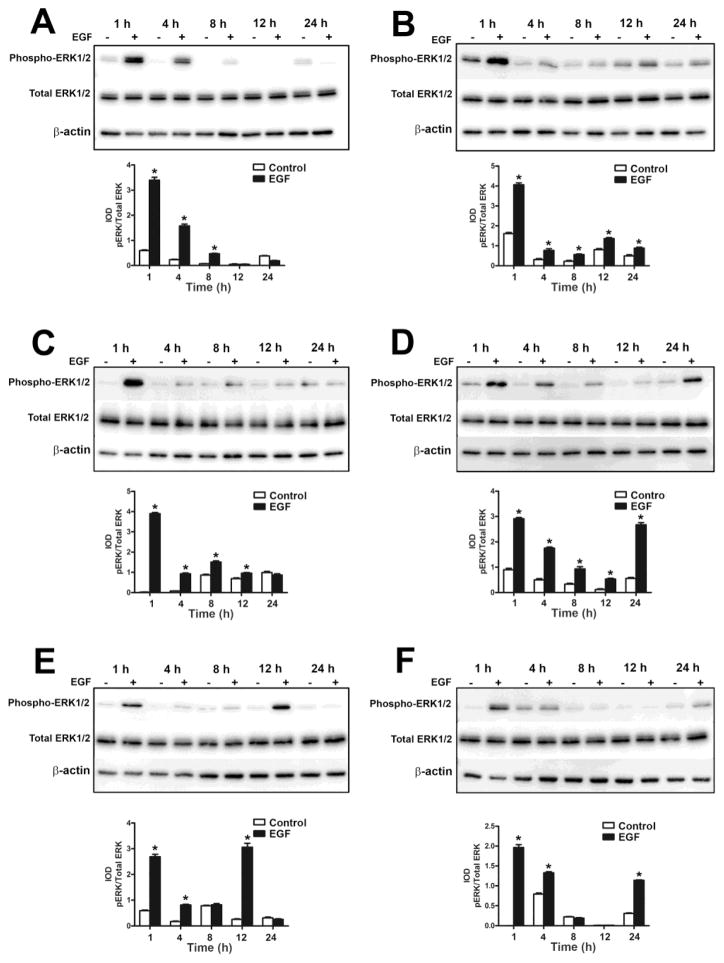
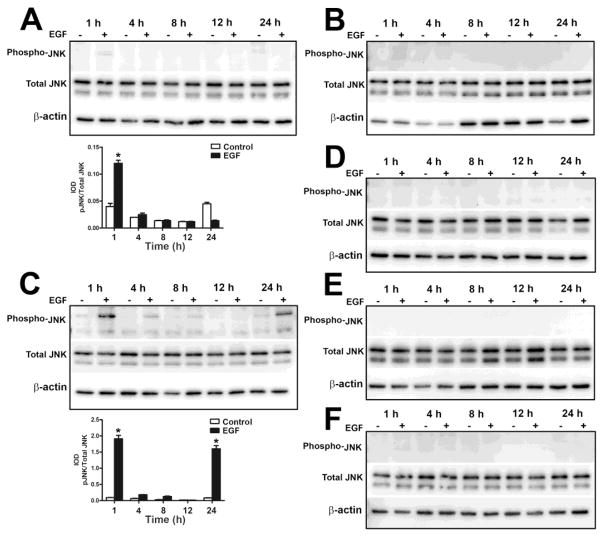
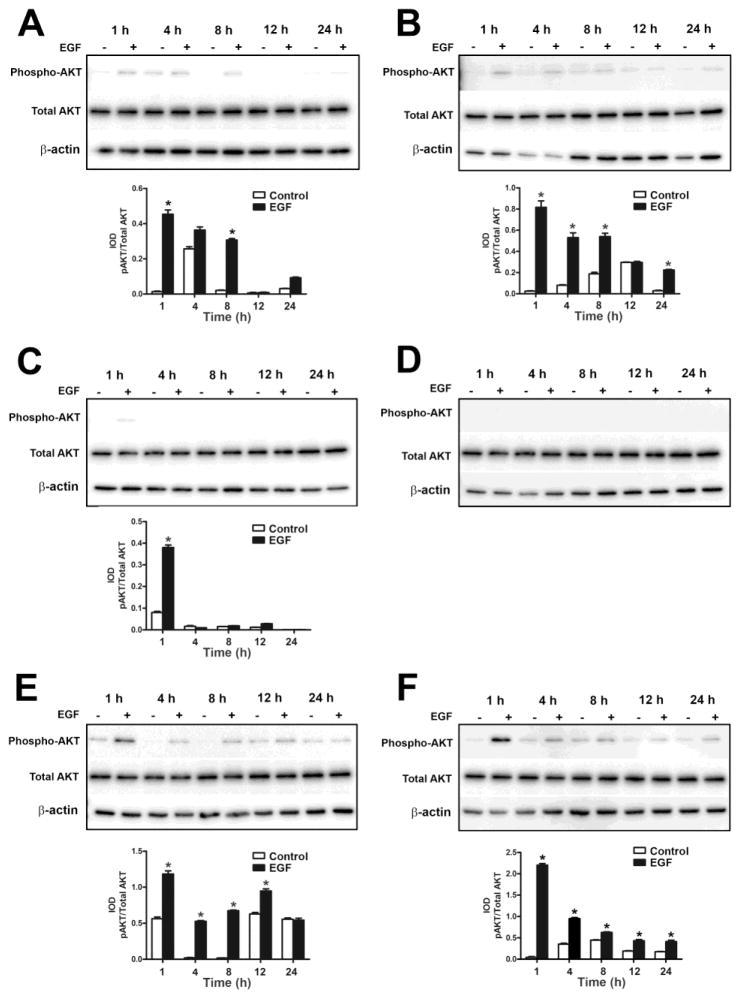
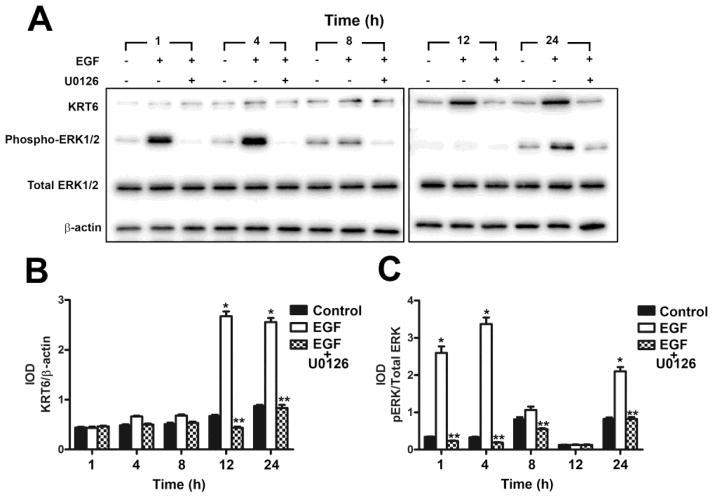
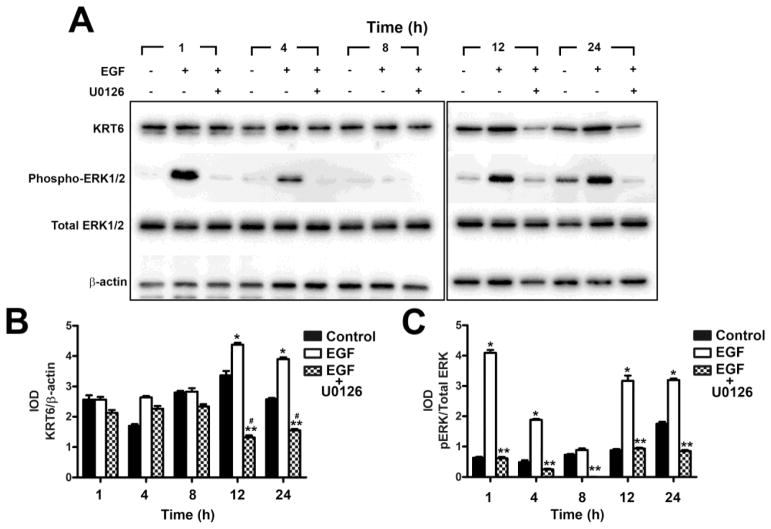
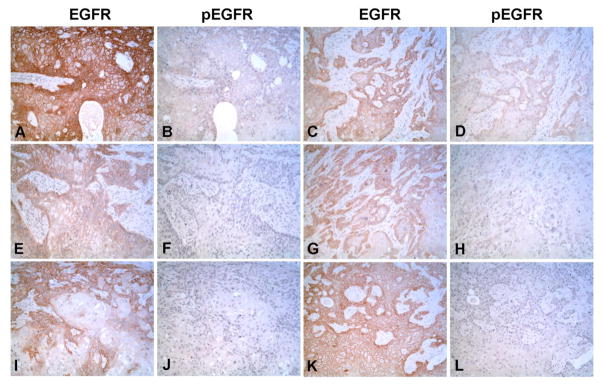
Urothelial cancers have an environmental etiological component, and previous studies from our laboratory have shown that arsenite (As+3) can cause the malignant transformation of the immortalized urothelial cells (UROtsa), leading to the expression of keratin 6 (KRT6). The expression of KRT6 in the parent UROtsa cells can be induced by the addition of epidermal growth factor (EGF). Tumors formed by these transformed cells have focal areas of squamous differentiation that express KRT6. The goal of this study was to investigate the mechanism involved in the upregulation of KRT6 in urothelial cancers and to validate that the As+3-transformed UROtsa cells are a model of urothelial cancer. The results obtained showed that the parent and the As+3-transformed UROtsa cells express EGFR which is phosphorylated with the addition of epidermal growth factor (EGF) resulting in an increased expression of KRT6. Inhibition of the extracellular-signal regulated kinases (ERK1/2) pathway by the addition of the mitogen-activated protein kinase kinase 1 (MEK1) and MEK2 kinase inhibitor U0126 resulted in a decrease in the phosphorylation of ERK1/2 and a reduced expression of KRT6. Immuno-histochemical analysis of the tumors generated by the As+3-transformed isolates expressed EGFR and tumors formed by two of the transformed isolates expressed the phosphorylated form of EGFR. These results show that the expression of KRT6 is regulated at least in part by the ERK1/2 pathway and that the As+3-transformed human urothelial cells have the potential to serve as a valid model to study urothelial carcinomas.

Keywords: Arsenite; Biomarker; Bladder cancer; Keratin 6; MAPK; UROtsa.


Conflict of interest statement

Conflict of interest

The authors declare that they have no competing interests.

Figures

Fig. 1
Fig. 1
Expression of KRT6 in UROtsa parent cells and the As+3-transformed UROtsa cells. (A). Real-time PCR analysis of KRT6a expression in UROtsa parent and As+3-transformed UROtsa cells. The data is expressed as transcripts of KRT6 per transcript of β-actin. (B and C). Western blot analysis of KRT6 expression in UROtsa parent and As+3-transformed UROtsa cells. The integrated optical densities (IOD) for each of the KRT6 band/β-actin is indicated. * indicates significantly different at p<0.05 from parent UROtsa cells.
Fig. 2
Fig. 2
Effect of EGF on the expression of KRT6 and the activation of EGFR and downstream kinases in the UROtsa parent cells. (A and B). Western blot analysis of KRT6 expression in UROtsa parent cells after treatment with EGF for various time periods. The integrated optical densities (IOD) for each of the KRT6 band/β-actin is indicated. (A – F). Phosphorylation of EGFR (A and C), ERK1/2 (A and D), JNK (A and E) and AKT (A and F) was determined by Western blotting. The IOD for each phosphorylated protein is plotted per total protein. * indicates significantly different at p<0.05 from untreated controls for each time point.
Fig. 3
Fig. 3
Effect of EGF on the expression of KRT6 in As+3-transformed UROtsa cells. (A – F). Western blot analysis of KRT6 expression in As#1 (A), As#2 (B), As#3 (C), As#4 (D), As#5 (E) and As#6 (F) cells. The integrated optical densities (IOD) for each of the KRT6 band/β-actin is indicated. * indicates significantly different at p<0.05 from untreated controls for each time point.
Fig. 4
Fig. 4
Effect of EGF on the phosphorylation of EGFR in As+3-transformed UROtsa cells. Western blot analysis of phosphorylation of EGFR in As#1 (A), As#2 (B), As#3 (C), As#4 (D), As#5 (E) and As#6 (F) cells. The IOD for phosphorylated EGFR is plotted per total EGFR. * indicates significantly different at p<0.05 from untreated controls for each time point.
Fig. 5
Fig. 5
Effect of EGF on the activation of ERK1/2 in As+3-transformed UROtsa cells. Western blot analysis of phosphorylation of ERK1/2 in As#1 (A), As#2 (B), As#3 (C), As#4 (D), As#5 (E) and As#6 (F) cells. The IOD for phosphorylated ERK1/2 is plotted per total ERK1/2. * indicates significantly different at p<0.05 from untreated controls for each time point.
Fig. 6
Fig. 6
Effect of EGF on the activation of JNK in As+3-transformed UROtsa cells. Western blot analysis of phosphorylation of JNK in As#1 (A), As#2 (B), As#3 (C), As#4 (D), As#5 (E) and As#6 (F) cells. The IOD for phosphorylated JNK is plotted per total JNK. * indicates significantly different at p<0.05 from untreated controls for each time point.
Fig. 7
Fig. 7
Effect of EGF on the activation of AKT in As+3-transformed UROtsa cells. Western blot analysis of phosphorylation of AKT in As#1 (A), As#2 (B), As#3 (C), As#4 (D), As#5 (E) and As#6 (F) cells. The IOD for phosphorylated AKT is plotted per total AKT. * indicates significantly different at p<0.05 from untreated controls for each time point.
Fig. 8
Fig. 8
Effect of MEK1/2 inhibitor U0126 on the expression of KRT6 in UROtsa parent cells. (A and B). Western blot analysis of KRT6 expression in UROtsa cells treated with the MEK1/2 inhibitor U0126. The IOD for each of the KRT6 band/β-actin is indicated. (A and C). Western blot analysis of phosphorylation of ERK1/2 in UROtsa cells treated with the MEK1/2 inhibitor U0126. The IOD for phosphorylated ERK1/2 is plotted per total ERK1/2. * indicates significantly increased at p<0.05 from untreated controls for each time point. ** indicates significantly decreased from EGF only treated cells at p<0.05 for each time point.
Fig. 9
Fig. 9
Effect of MEK1/2 inhibitor U0126 on the expression of KRT6 in As+3-transformed UROtsa cells. (A and B). Western analysis of KRT6 expression in UROtsa cells treated with the MEK1/2 inhibitor U0126. The IOD for each of the KRT6 band/β-actin is indicated. (A and C). Western analysis of phosphorylation of ERK1/2 in As+3-transformed UROtsa cells treated with the MEK1/2 inhibitor U0126. The IOD for phosphorylated ERK1/2 is plotted per total ERK1/2. * indicates significantly increased at p<0.05 from untreated controls for each time point. ** indicates significantly decreased from EGF only treated cells at p<0.05 for each time point. # indicates significantly decreased from untreated controls at p<0.05 for each time point.
Fig. 10
Fig. 10
Immunohistochemical staining of EGFR and pEGFR in As+3-transformed subcutaneous tumor heterotransplants. (A, C, E, G, I and K). Staining for EGFR in the As+3-transformed cell line As#1, As#2, As#3, As#4, As#5 and As#6 respectively. B, D, F, H, J and L. Staining for pEGFR in As#1, As#2, As#3, As#4, As#5 and As#6 respectively. The staining is localized to the cell membrane for both EGFR and pEGFR and is most intense at the periphery of the tumor nests and less intense or absent in the center of the nests All micrographs are at x100 magnification.

References

    1. Akdas A, Turkeri L. The impact of squamous metaplasia in transitional cell carcinoma of the bladder. Int J Urol Nephrol. 1990;23:333–336. - PubMed
    1. Bellmunt J, Hussain M, Dinney CP. Novel approaches with targeted therapies in bladder cancer. Crit Rev Oncol Hematol. 2003;46:85–104. - PubMed
    1. Black PC, Agarwal PK, Dinney CP. Targeted therapies in bladder cancer - an update. Urol Oncol. 2007;25:433–438. - PubMed
    1. Cantor KP, Lubin JH. Arsenic, internal cancers, and issues in inference from studies at low-level exposures in human populations. Toxicol Appl Pharmacol. 2007;222:252–257. - PMC - PubMed
    1. Cao L, Zhou XD, Sens MA, Garrett SH, Zheng Y, Dunlevy JR, Sens DA, Somji S. Keratin 6 expression correlates to areas of squamous differentiation in multiple independent isolates of As+3-induced bladder cancer. J Appl Toxicol. 2010;30:416–430. - PMC - PubMed

Publication types