. 2017 Jul;16(7):1286-1296.
doi: 10.1074/mcp.RA117.000015. Epub 2017 May 13.

Stability of Proteins in Dried Blood Spot Biobanks

Affiliations

Stability of Proteins in Dried Blood Spot Biobanks

Johan Björkesten et al. Mol Cell Proteomics. 2017 Jul.

Abstract

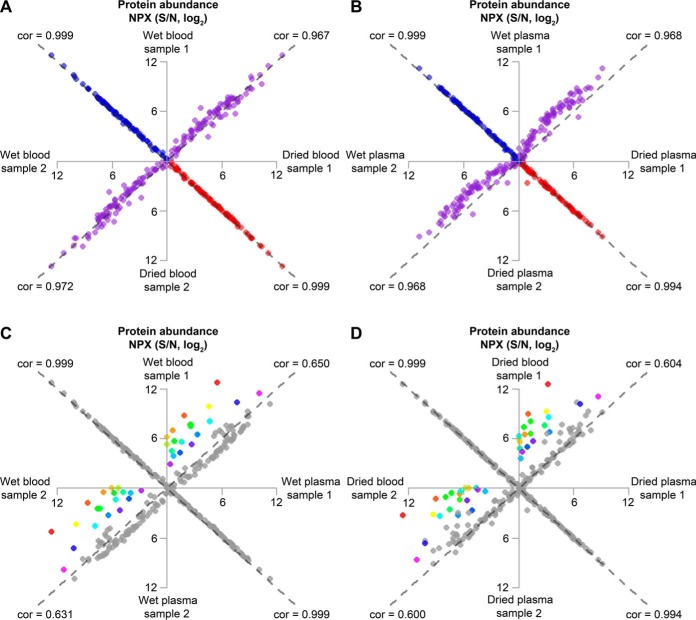
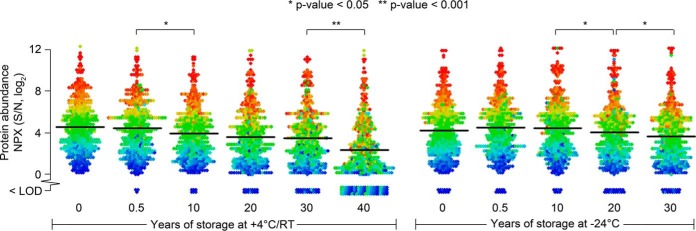
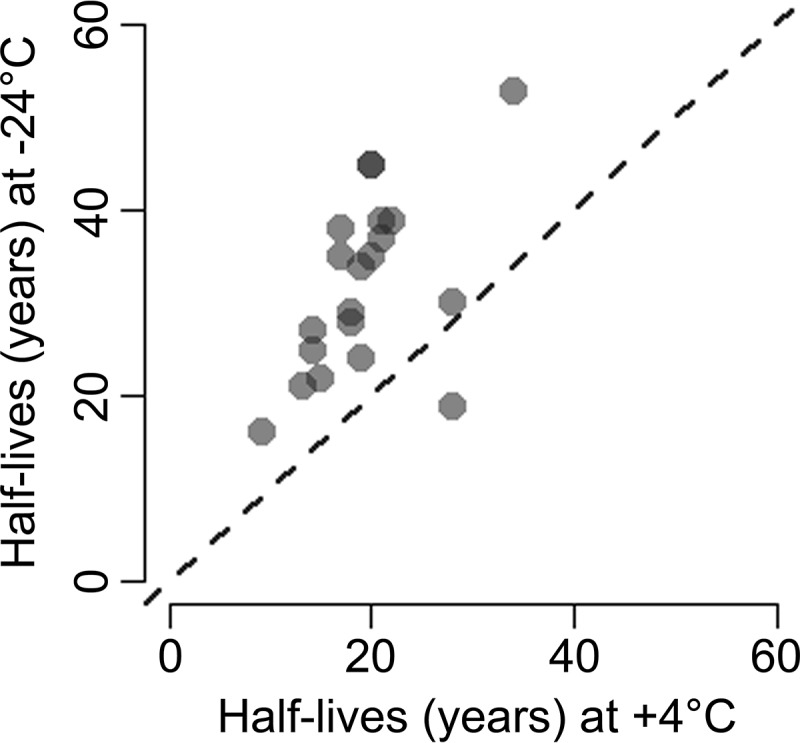
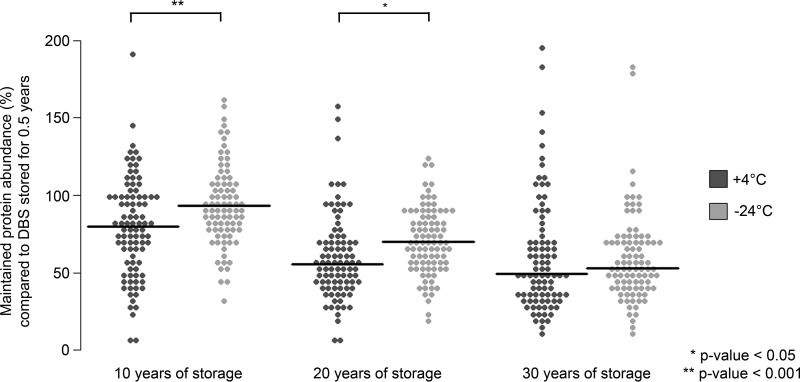
An important motivation for the construction of biobanks is to discover biomarkers that identify diseases at early, potentially curable stages. This will require biobanks from large numbers of individuals, preferably sampled repeatedly, where the samples are collected and stored under conditions that preserve potential biomarkers. Dried blood samples are attractive for biobanking because of the ease and low cost of collection and storage. Here we have investigated their suitability for protein measurements. Ninety-two proteins with relevance for oncology were analyzed using multiplex proximity extension assays (PEA) in dried blood spots collected on paper and stored for up to 30 years at either +4 °C or -24 °C.Our main findings were that (1) the act of drying only slightly influenced detection of blood proteins (average correlation of 0.970), and in a reproducible manner (correlation of 0.999), (2) detection of some proteins was not significantly affected by storage over the full range of three decades (34 and 76% of the analyzed proteins at +4 °C and -24 °C, respectively), whereas levels of others decreased slowly during storage with half-lives in the range of 10 to 50 years, and (3) detectability of proteins was less affected in dried samples stored at -24 °C compared with at +4 °C, as the median protein abundance had decreased to 80 and 93% of starting levels after 10 years of storage at +4 °C or -24 °C, respectively. The results of our study are encouraging as they suggest an inexpensive means to collect large numbers of blood samples, even by the donors themselves, and to transport, and store biobanked samples as spots of whole blood dried on paper. Combined with emerging means to measure hundreds or thousands of protein, such biobanks could prove of great medical value by greatly enhancing discovery as well as routine analysis of blood biomarkers.


Conflict of interest statement

Competing interests: U.L. is a founder of and holds stock in Olink Proteomics commercializing the PEA panels used herein

Figures

Fig. 1.
Fig. 1.
Abundances of 92 proteins of relevance in oncology, measured with PEA technology from whole blood or plasma samples in either dried or liquid form. Duplicate samples were used to evaluate relations of protein levels in wet and in dried samples, and in blood and plasma samples. The results are visualized in scatterplots, containing four correlations each. A, Correlations of protein abundance between wet and dried EDTA blood samples (purple) and technical replicates for wet EDTA blood (blue) and dried EDTA blood (red) samples. B, Correlations of protein abundance between wet and dried EDTA plasma (purple) and technical replicates for wet EDTA plasma (blue) and dried EDTA plasma (red) samples. C, Correlations between protein levels in wet EDTA blood and wet EDTA plasma (colored/gray) and technical replicates for wet EDTA blood and wet EDTA plasma (gray). D, Correlations between dried EDTA blood and dried EDTA plasma (colored/gray) and technical replicates for dried EDTA blood and dried EDTA plasma. The 20 proteins exhibiting the highest average fold differences between whole blood and plasma (farthest away from the dashed gray line of equivalence) in the comparisons between protein measurements in wet blood and plasma in (C) were assigned individual colors, and the same colors were applied for the dried blood and plasma samples in (D) and in supplemental Table S4. The results demonstrate that this group of colored proteins exhibited similar patterns of elevated levels in blood compared with in plasma in both wet and dried samples. All other protein measurements in the comparisons between blood and plasma are colored gray. The calculated correlation values are based on the rank based Spearman method. The gray dashed lines correspond to the equivalence between compared samples (x = y). Individual levels of LOD (log2-scale) have been subtracted from NPX values (log2-scale) for each protein. The dried samples were also normalized for the shift in background levels measured from the paper material control sample. Any resulting negative values (signals below LOD) were set to zero.
Fig. 2.
Fig. 2.
Distribution of measurements for 92 proteins in DBS samples stored at +4 °C or −24 °C for up to 30 years. Dried blood samples were grouped based on storage time and storage temperature, generating 11 groups, and for each group protein values are displayed for 5 individuals for a total of 460 data points in each group. For each protein the LOD in NPX values (log2-scale) has been subtracted from the measured NPX values (log2-scale). Any resulting negative values (undetectable levels) were set to <LOD. The distribution of data points in the different groups was visualized as bee swarm plots. Each of the 92 different proteins was assigned an individual color nuance on a scale from red to blue according to their average levels of expression in samples stored for 0 years. The assignment of colors was performed separately for samples stored at RT/+4 °C or at −24 °C. The line in each distribution represents the group average for all proteins (proteins below LOD were assigned a value of zero for this calculation). The samples stored for 40 years were first stored for 6 years at RT and subsequently for 34 years at +4 °C. All other samples were kept at +4 °C or −24 °C the entire storage time. Independent 2-group t-tests were used to evaluate the significance of differences between nearby groups. Significant differences (p value < 0.05) were demonstrated for four comparisons as indicated by asterisks. The most significant difference was observed between samples stored for 30 or 40 years at +4 °C and RT/+4 °C, respectively (p value = 10−10).
Fig. 3.
Fig. 3.
Abundance of proteins measured in DBS stored between 0 and 30 years at +4 °C or −24 °C. DBS samples from five individuals were analyzed for each condition. NPX values above LOD (protein abundance above background on a log2 scale) for six proteins were visualized in scatterplots together with linear regression models (dashed lines), demonstrating effects of storage time on measured protein levels. The six proteins highlighted in the figure are alpha-taxilin (TXLNA), delta-like protein 1 (DLL1), Wnt inhibitory factor 1 (WIF1), transmembrane glycoprotein NMB (GPNMB), T-cell leukemia/lymphoma protein 1A (TCL1A) and protein S100-A11 (S100A11). Samples stored for 0 years are represented with crosses and samples stored for 0.5, 10, 20, and 30 years are represented with open circles. The measured levels of the three proteins in the top row clearly decreased with increasing storage time, while no significant effect was demonstrated for the three proteins in the bottom row. The patterns were similar for samples stored at +4 °C and −24 °C but recorded levels of the three unstable proteins decreased faster at the higher storage temperature.
Fig. 4.
Fig. 4.
Half-lives in years visualized in a scatter plot for the 20 investigated proteins that decreased significantly with increasing time of storage of DBS samples at +4 °C and −24 °C. The half-lives were calculated from linear models based on NPX (protein abundance on a log2 scale) values and storage time. One half-life is the time required for the average level of a protein measurement to decrease by one NPX unit. 19 out of the 20 proteins exhibited longer half-lives for samples stored at −24 °C. The dashed line represents equal half-life for samples stored at +4 °C and −24 °C (x = y).
Fig. 5.
Fig. 5.
Bee swarm plots visualizing the distributions of relative maintained signals for the 92 proteins analyzed compared with samples stored for 0.5 year at +4 °C and −24 °C. The DBS samples were stored at +4 °C (dark gray) or −24 °C (light gray). The median value for each protein among the five individuals analyzed in each group was used for the analysis. The black lines in the distributions represent median values across all proteins. The median maintained signal across all investigated proteins are 80, 55 and 49% for the samples stored for 10, 20, and 30 years at +4 °C, respectively, and 93, 70 and 53% for the samples stored for 10, 20, and 30 years at −24 °C, respectively. Independent two group t-tests were used to evaluate statistical significances between the groups as indicated by asterisks. Outliers are not shown for visualization purposes but were included in the evaluation of statistical significances. The outliers were in total 12 measurements in the range between 200 and 420% of maintained signals. 8 out of the 12 outliers were in the group of samples stored at −24 °C for 10 years. The plot area was constrained between zero and 200% of relative signal.

Similar articles

Cited by

References

    1. Grüner N., Stambouli O., and Ross R. S. (2015) Dried blood spots - preparing and processing for use in immunoassays and in molecular techniques. J. Vis. Exp. JoVE. doi:10.3791/52619 - DOI - PMC - PubMed
    1. Wilhelm A. J., den Burger J. C., and Swart E. L. (2014) Therapeutic drug monitoring by dried blood spot: progress to date and future directions. Clin. Pharmacokinet. 53, 961–973 - PMC - PubMed
    1. Ignjatovic V., Pitt J., Monagle P., and Craig J. M. (2014) The utility of dried blood spots for proteomic studies: looking forward to looking back. Proteomics Clin. Appl. 8, 896–900 - PubMed
    1. McDade T. W., Williams S., and Snodgrass J. J. (2007) What a drop can do: dried blood spots as a minimally invasive method for integrating biomarkers into population-based research. Demography 44, 899–925 - PubMed
    1. Razavi M., Anderson N. L., Yip R., Pope M. E., and Pearson T. W. (2016) Multiplexed longitudinal measurement of protein biomarkers in DBS using an automated SISCAPA workflow. Bioanalysis 8, 1597–1609 - PubMed

Publication types

Substances