. 2017 May 18;169(5):849-861.e13.
doi: 10.1016/j.cell.2017.04.027. Epub 2017 May 11.

Tracing the Enterococci from Paleozoic Origins to the Hospital

Affiliations

Tracing the Enterococci from Paleozoic Origins to the Hospital

François Lebreton et al. Cell. .

Abstract

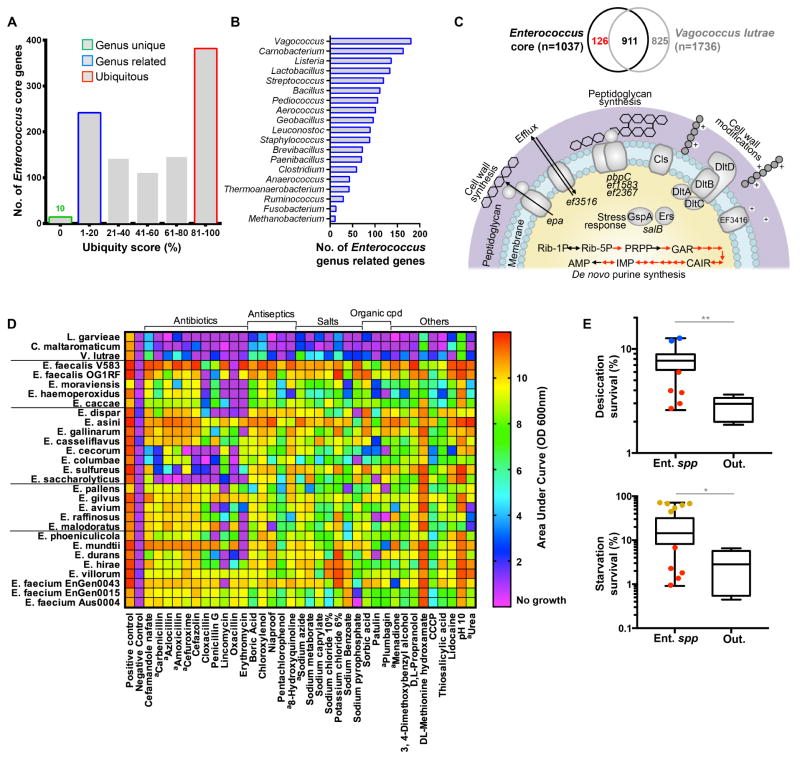
We examined the evolutionary history of leading multidrug resistant hospital pathogens, the enterococci, to their origin hundreds of millions of years ago. Our goal was to understand why, among the vast diversity of gut flora, enterococci are so well adapted to the modern hospital environment. Molecular clock estimation, together with analysis of their environmental distribution, phenotypic diversity, and concordance with host fossil records, place the origins of the enterococci around the time of animal terrestrialization, 425-500 mya. Speciation appears to parallel the diversification of hosts, including the rapid emergence of new enterococcal species following the End Permian Extinction. Major drivers of speciation include changing carbohydrate availability in the host gut. Life on land would have selected for the precise traits that now allow pathogenic enterococci to survive desiccation, starvation, and disinfection in the modern hospital, foreordaining their emergence as leading hospital pathogens.

Keywords: Enterococcus; Paleozoic; antibiotic resistance; commensal; early life; hospital acquired infection; origins; speciation; terrestrialization.


Figures

Figure 1
Figure 1. Genome-based phylogeny of the Enterococcus genus
A: Distribution of Enterococcus species genome sizes (color coded by phylogenetic group). B: Phylogenomic tree of Enterococcus and outgroup species (grey) based on alignment of 526 single copy core genes. Species groups: E. faecalis group (blue), E. columbae group (green), E. pallens group (red) and E. faecium group (yellow). Each node is assigned a unique numeric identifier. Icons represent host associations inferred from both qualitative and quantitative (Table S2) analyses of the literature. C: Prevalence of Enterococcus and Vagococcus in the GI tract of land (n= 492) or aquatic hosts (n= 1300) isolated from the wild. Presence or absence was determined by 16S rDNA analysis of microbiome samples available in public databases (Table S3). Mean and SEM are indicated. Statistical significance was evaluated by Fisher’s Exact Test.
Figure 2
Figure 2. Genetic and phenotypic differences from outgroup species
A: Ubiquity of 1037 Enterococcus core genes in eubacteria (BlastX against 100 representative eubacterial genomes, Table S4 tab 2), in quintiles. B: Genera of microbes harboring genes seldom found outside of enterococci (1st quintile 1 – 20 genera), ranked by the number of 1st quintile genes shared. C: Above, Venn diagram showing shared and unique genes in Enterococcus core genome and Vagococcus lutrae LBD1. Below, Diagram highlighting role of functional groups of Enterococcus core genes not occurring in Vagococcus: De novo purine biosynthesis potentially feeding into stress response (12 genes displayed with red arrows, p< 0.0001), cell wall biosynthesis and modification (15 genes, p= 0.0002) and stress response (3 genes). PRPP, phosphoribose pyrophosphate; GAR, glycinamide ribonucleotide; CAIR, carboxyaminoimidazole ribonucleotide; IMP, Inosine monophosphate; AMP, Adenosine monophosphate. D: Heatmap showing significant differences in average growth (at least 2-fold greater average growth, p < 0.01) between enterococcal and outgroup species in Biolog phenotype screen. aCompounds showing a similar pattern when tested in multiple concentrations. E: Survival to desiccation and starvation by Enterococcus spp. (Ent. spp) compared to outgroup strains V. lutrae LBD1, V. fluvialis DIV0098, C. maltaromaticum ATCC35586, L. garviae NCIMB31208 and DIV0709 (Out.). Box plots drawn using the average survival value from three independent experiments for each strain. Box plots show the median, first and third quartiles and min/max values. Colored data points show the mean values for strains from selected enterococcal phylogenetic groups (Fig. 1A).
Figure 3
Figure 3. Functional classification of niche specifying genes
A: Phylogenetic analysis using parsimony (PAUP) and minimization of the number of gain/loss events predicting flux in gene content since last common ancestor (blue = gain; red = loss) at nodes (italicized numbers 1 to 28) and leaves of the SNP-based phylogenetic tree. The size of the pie chart reflects the amplitude of total gene flux (gain + loss). B, COG functional classification of Enterococcus core genes, and niche specifying gene groups.
Figure 4
Figure 4. Host-adaptation of enterococci
A: Carbohydrate utilization for E. faecalis (E.fs) and M. plutonius (M.pl). Other tested carbohydrates, by Biolog phenotype microarrays, are shown on the full profiles (Fig. S4A). B: Metabolic pathways gained or lost by M. plutonius since node 2 (Fig. 3A). Each arrow represents an enzymatic step (black = ancestral enzyme; grey = no gene in Enterococcus yet associated; blue = gained; red = lost) of the KEGG pathways predicted for E. faecalis V583 and M. plutonius ATCC35311. Other key features gained by M. plutonius: restriction system type I and III (Rm-1, -3); high mannose N-linked glycan biosynthesis (Poly N-Man); Ox-P, oxidative phosphorylation. C: Representative results of pH based phenotypic screen for uric acid metabolism (color change to yellow indicates acidification, color change to red indicates uric acid metabolism by alkalinity from ammonia release). Typical result for E. faecalis or other enterococcal species (Ent. spp.) when provided no carbon source, uric acid (UA) only, or glucose (Glu) and uric acid as indicated (TnUA – representative result for each of the E. faecalis insertion mutants lacking the ability to produce NH4+ in the presence of urate). D: Competitive index for growth in vitro (BHI, to control for growth advantage or defect of the transposon mutant versus the wild-type strain in rich media), or in colonization of the GI tract of G. mellonella larvae, for E. faecalis MMH594 (WT) over the CFU of the indicated uric acid metabolism deficient mutant (Mut) recovered. E: Carbohydrate utilization for bird-associated E. cecorum (E.ce) and E. columbae (E.co). Other tested carbohydrates are shown on the full Biolog profiles (Fig. S4A). F: Metabolic pathways, gained (blue arrows) or lost (red arrows) by E. columbae since node 15 (Fig. 3A), predicted by searching the KEGG pathway map. Chemotaxis (Chem.); flagellar motility (Mot.).
Figure 5
Figure 5. Calibration of enterococcal evolution
A: Average Nucleotide Identity plot. Each dot represents a pairwise comparison of two genomes. Enterococcus spp. versus outgroup species (grey); Enterococcus spp. versus M. plutonius (red); Enterococcus spp. versus T. halophilus (green); intra-genus comparisons (black). B: Calibration of ANI scale with divergence times and ANI values calculated for E. coli versus S. typhimurium and Vibrio spp.; and A. hydrophila versus other Aeromonas spp. Larger black dots represent the mANI for E. coli versus S. typhimurium (which diverged 140 MYA); mANI for A. hydrophila versus other Aeromonas spp. (which diverged 184 MYA); and mANI for E. coli versus Vibrio spp. (which diverged 400 MYA). Published range of error for each is shown by flanking small black dots. Horizontal brown bars represent a speciation event at a given mANI value within the Enterococcus genus (corresponding to nodes in Fig. 1B phylogenetic tree) and the horizontal blue bar represents the last common ancestor (LCA) with an outgroup species. C: Fossil record corrected version of panel B, with theoretical origin of Enterococcus genus (i.e. after divergence from LCA with outgroup genus and before first Enterococcus speciation event) anchored to the initial terrestrialization of animals 425 MYA (vertical grey line).
Figure 6
Figure 6. Ancient origins
The timing of nodes divergence was calculated by mANI analysis (Fig. 5A), using a bacterial molecular clock (Fig. 5B) refined by correlation with fossil records (Fig. 5C), conservatively rooting the theoretical emergence of Enterococcus to the terrestrialization of animals by 425 MYA. Enterococcal diversity (left y-axis and tan area) represents the cumulative number of enterococcal lineages through time. Land animal diversity, computed from fossil records, (right y-axis and grey area), shows fluctuation in number of animal families over the same time scale. The position of animal classes on the time scale indicates periods of evolutionary radiations.

Comment in

References

    1. Aarestrup FM, Butaye P, Witte W. Nonhuman Reservoirs of Enterococci. In: Gilmore M, editor. The Enterococci. American Society of Microbiology; 2002. pp. 55–99.
    1. Adams Krumins J, van Oevelen D, Martijn Bezemer T, De Deyn GB, Gera Hol WH, van Donk E, de Boer W, de Ruiter PC, Middelburg JJ, Monroy F, et al. Soil and Freshwater and Marine Sediment Food Webs: Their Structure and Function. BioScience. 2013;63:35–42.
    1. Altschul SF, Gish W, Miller W, Myers EW, Lipman DJ. Basic local alignment search tool. J Mol Biol. 1990;215:403–410. - PubMed
    1. Arias CA, Murray BE. The rise of the Enterococcus: beyond vancomycin resistance. Nat Rev Microbiol. 2012;10:266–278. - PMC - PubMed
    1. Azam F, Malfatti F. Microbial structuring of marine ecosystems. Nat Rev Microbiol. 2007;5:782–91. Review. Erratum in: Nat Rev Microbiol. (2007). 5:966. - PubMed

Substances

LinkOut - more resources