. 2017 May 18;169(5):862-877.e17.
doi: 10.1016/j.cell.2017.04.026. Epub 2017 May 11.

Metabolic Phenotypes of Response to Vaccination in Humans

Affiliations

Metabolic Phenotypes of Response to Vaccination in Humans

Shuzhao Li et al. Cell. .

Abstract

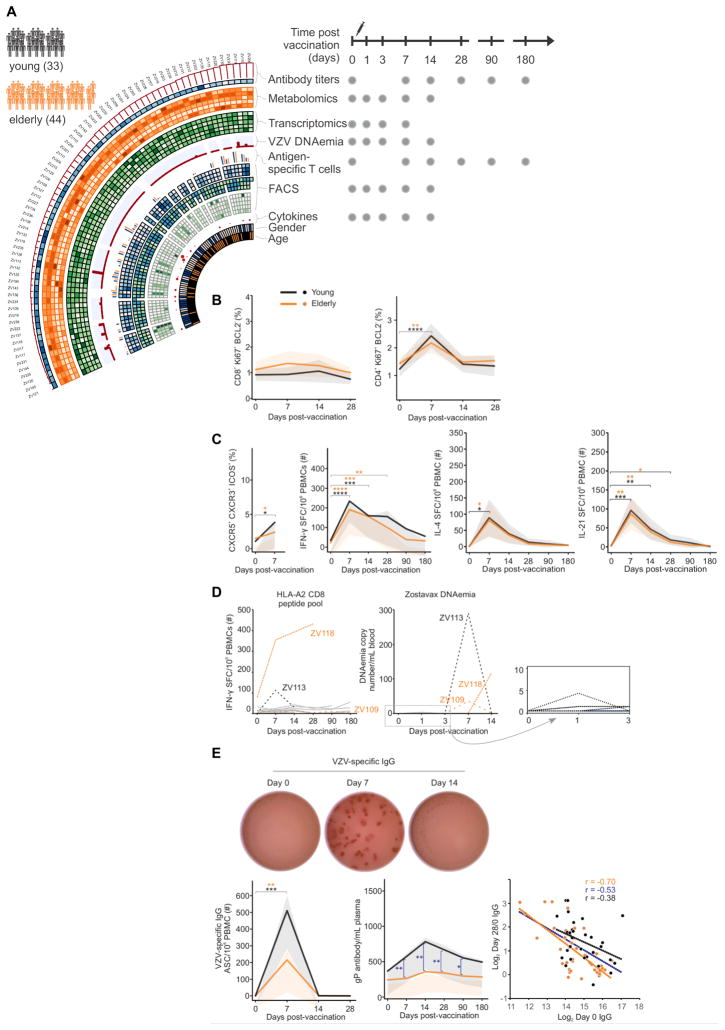
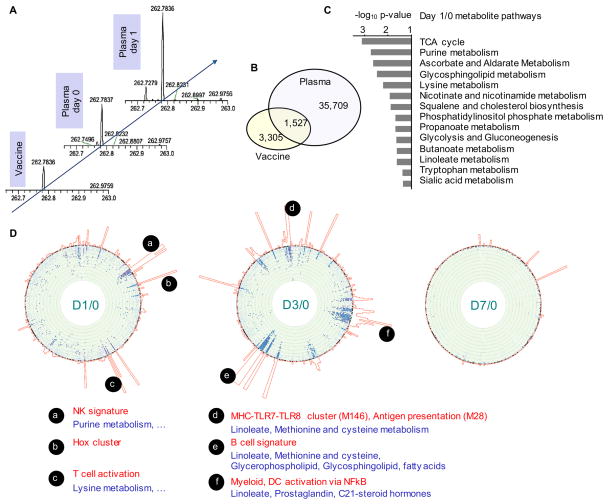
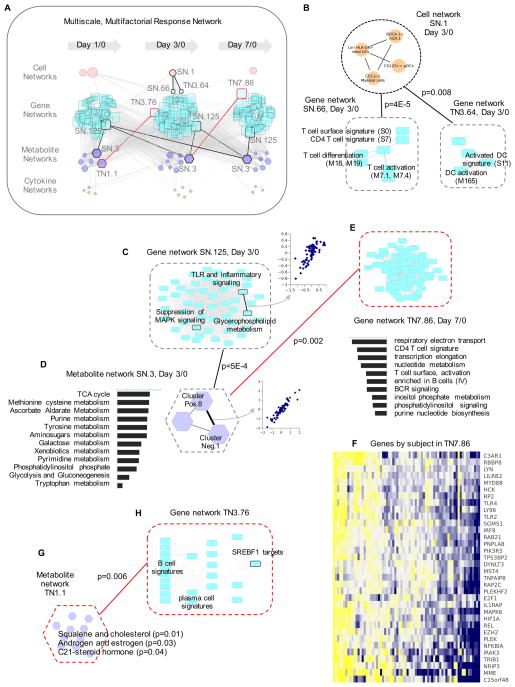
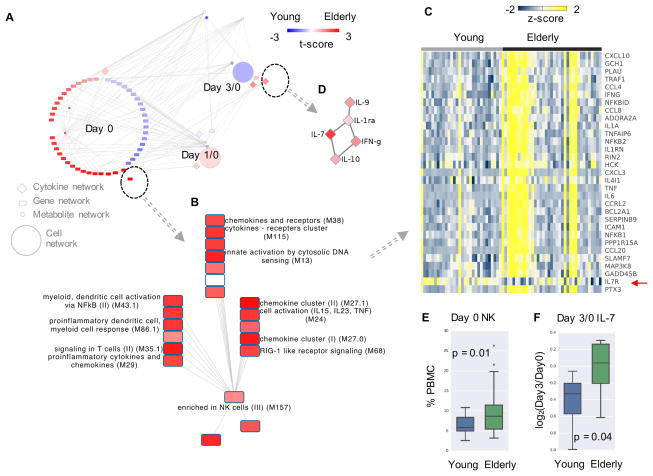
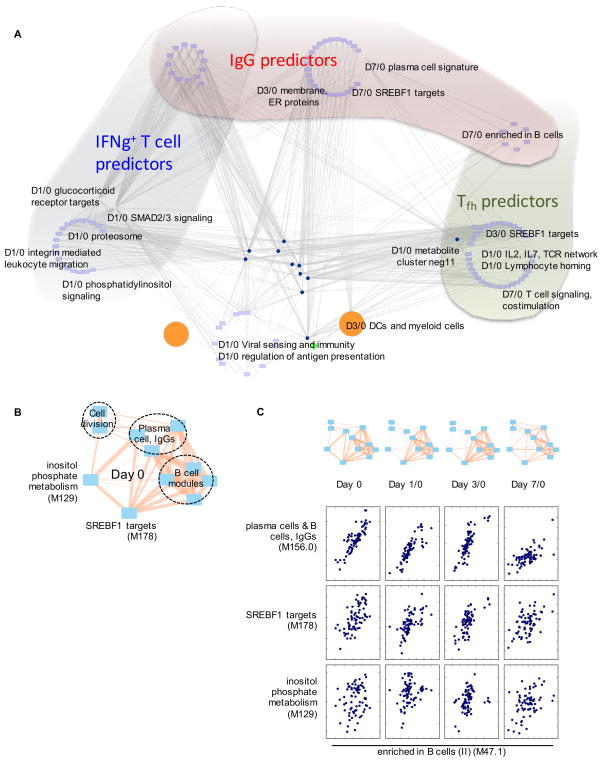
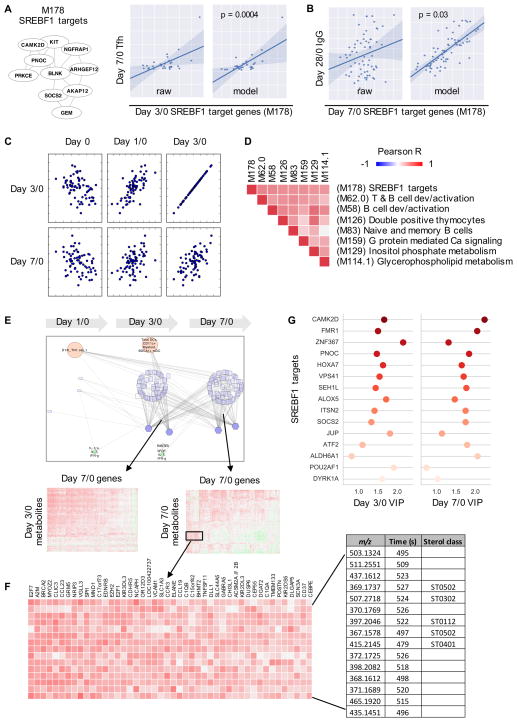
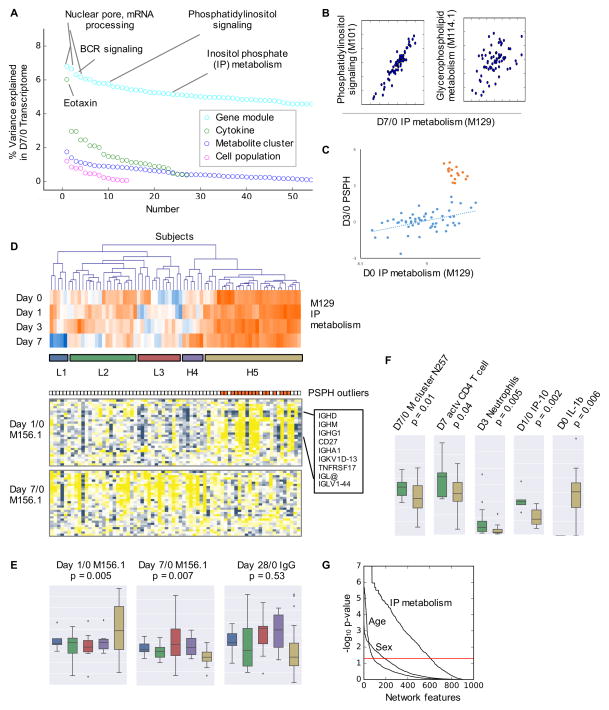
Herpes zoster (shingles) causes significant morbidity in immune compromised hosts and older adults. Whereas a vaccine is available for prevention of shingles, its efficacy declines with age. To help to understand the mechanisms driving vaccinal responses, we constructed a multiscale, multifactorial response network (MMRN) of immunity in healthy young and older adults immunized with the live attenuated shingles vaccine Zostavax. Vaccination induces robust antigen-specific antibody, plasmablasts, and CD4+ T cells yet limited CD8+ T cell and antiviral responses. The MMRN reveals striking associations between orthogonal datasets, such as transcriptomic and metabolomics signatures, cell populations, and cytokine levels, and identifies immune and metabolic correlates of vaccine immunity. Networks associated with inositol phosphate, glycerophospholipids, and sterol metabolism are tightly coupled with immunity. Critically, the sterol regulatory binding protein 1 and its targets are key integrators of antibody and T follicular cell responses. Our approach is broadly applicable to study human immunity and can help to identify predictors of efficacy as well as mechanisms controlling immunity to vaccination.

Keywords: Zostavax; herpes zoster vaccine; immune response; metabolomics; multiscale; shingles; systems biology; transcriptomics.


Figures

Figure 1
Figure 1. Zostavax® study overview, cellular and antibody responses
A) Study overview. 77 subjects as either young adults (25–40 yo, n=33) or elderly (60–79 yo, n=44). Different samples were taken at baseline (day 0), and 1, 3, 7, 14, 28, 90 and 180 days. Please refer to STAR methods (supplemental) for details. B) CD8+ and CD4+ T cell activation as measured by Ki67+Bcl2- in young adults (black, n=13 for CD8+, n=15 for CD4+) and the elderly (orange, n=19 for CD8+, n=21 for CD4+). Mean values in solid lines, and shades for 90% confidence interval. C) Increase in VZV-specific Tfh-like cells (as measured by CXCR5+ICOS+CXCR3+) in young adults (n=16) and the elderly (n=20). Antigen-specific IFN-γ, IL-4 or IL-21 production by CD4+ T cells as measured by ELISPOT in young adults (n=17) and the elderly (n=22). SFC = Spot forming cells. D) Antigen-specific CD8+ T cell responses and Zostavax DNAemia in a subset of HLA-A2+ individuals (n=13). PBMCs stimulated with previously published VZV-HLA-A2 restricted peptides overnight and IFN-γ measured via ELISPOT. Viral DNA copies in blood measured by PCR E) Representative VZV-specific IgG ELISPOT. Number of Zostavax®-specific plasmablasts in young adults (n=5) and the elderly (n=8). Kinetic analysis of Zostavax® glycoprotein-specific IgG antibodies as measured by ELISA in young adults (n=16) and the elderly (n=21). Inverse correlation between VZV-specific IgG at baseline and day 28 response is shown for young (black), elderly (organge) and the total cohort (blue). Comparison between the two groups was done using unpaired t-test. Comparison of response between different time points was done using paired t-test. *p<0.05, ** p<0.01, ***p<0.005, **** p<0.0001.
Figure 2
Figure 2. Plasma metabolomics and association with PBMC transcriptomics after Zostavax® vaccination
A) Illustration of chromatographic peaks identified in high-resolution metabolomics. The peaks across individuals and time points were aligned based on accurate mass-to-charge ratio (m/z) and LC retention time (not shown). B) Common peaks detected in both Zostavax® vaccine and vaccinee plasma samples (across days 0, 1, 3, 7, 14). Data shown for negative ionization. C) Significantly enriched pathways for Day 1 vs Day 0 (both negative and positive ionization), by the mummichog software (Li et al., 2013). D) Metabolome-wide association with transcriptomics. The “chromosome” bands on the circular edge are 346 BTM gene modules in fixed order. Towards the center of the circle are scatter plots of −log10 p-values of metabolites that are significantly associated with the respective gene module (p < 0.01). Each dot represents a metabolite peak, blue from positive ionization, purple from negative ionization. Only metabolite peaks with FDR < 0.1 are shown on the foreground. The joined histograms outside of the BTM bands indicate the number of significant metabolites for each gene module.
Figure 3
Figure 3. Multiscale, multifactorial response network (MMRN) of Zostavax® vaccination
A) MMRN consists of correlation networks using data from metabolomics, transcriptomics, cytokines and cell frequencies. Each node is a child network of one data type. The links between nodes were established by significant association using partial least square regression and permutation test. In the highlighted examples, black lines are for stable networks, red lines transient networks. B–H) are examples taken from the MMRN, where black dashed outlines indicate stable networks, red transient networks. B) Connections between a cell network and two gene networks. C) Gene network SN.125, where the callout scatter plot shows the correlation between two gene modules, TLR and inflammatory signaling and glycerophospholipid metabolism. D) Metabolite network SN.3. The callout scatter plot on the right shows the correlation between two metabolite clusters measured by positive ionization (Pos.8) and negative ionization (Neg.1). The histogram on the left shows the top pathways in this metabolite network, ranked by −log10 p-value. E) Gene network TN7.86, a day 7/0 transient network connected with day 3/0 metabolite network SN.3. The histogram under the network shows its top gene modules, ranked by the number of connections. F) Selected genes from the gene network TN7.86.
Figure 4
Figure 4. Age difference explained by MMRN
A) The subnetwork from MMRN related to age groups, colored by t-score in comparison between the young and elderly groups. Red indicates higher value in elderly. The most significant gene network is shown in B) and C), cytokine network in D). In C), each column represents a subject at day 0, colored by z-scores of gene expression values. IL7R is marked by a red arrow. E) Baseline NK cell frequencies measured by flow cytometry. F) Day 3/0 IL-7 levels measured by Luminex.
Figure 5
Figure 5. Predictors of adaptive immune response are redundant and dynamic
A) The significant predictors of IgG (Figure S7B), IFNg+ T cells and Tfh like cells (Table S5) were identified using multivariate regression, then queried against the MMRN. The query results are extensively connected in MMRN, whereas different groups of predictors are placed in different shades. The nodes at the bottom center were not part of the predictors, but included due to their network connections. B–C) The top antibody predictors are correlated with each other, while the correlation patterns change over time. Inositol phosphate metabolism is a predictor of T cell response, included here as reference. The edge width in the networks is proportional to Pearson correlation coefficient (0.30 to 0.99).
Figure 6
Figure 6. Sterol metabolism integrates cellular and humoral responses
A–B) The BTM module M178 contains 10 SREBF1 target genes. The expression level of this module at day 3/0 is predictive of the increase of Tfh-like cells, at day 7/0 predictive of IgG response. Each dot represents one subject. Model shows predicted values using a regression model accounting for age, sex and study site (and baseline IgG for the last panel). C) Scatter plots showing the expression level of M178 at different time points on both axes. D) Correlation of M178 with other gene modules at day 7/0. The orders on X and Y-axes are symmetrical. E–F) The MMRN subnetwork associated with M178. Gene and metabolite correlations are further shown in callout heatmaps and in F). A subset of the metabolites in F) are matched to sterol classes as designated in the LIPID MAPS database. G) Top SREBF1 target genes included in the network in E), indicated by their variable importance by projection (VIP) at days 3/0 and 7/0.
Figure 7
Figure 7. Immune phenotyping by inositol phosphate metabolism
A) Percent of variance in the day 7/0 transcriptome explained by each data types, using weighted average of the variance captured by the first five principal components (Nath et al., 2012). B) Scatter plots of day 7/0 expression of IP metabolism (M129) in relation to day 7/0 phosphatidylinositol signaling and day 7/0 glycerophospholipid metabolism. Each dot represents one subject. C) The expression of PSPH gene at day 3/0, correlated with baseline inositol phosphate metabolism, reveals an outlier group in the cohort. D) Hierarchical clustering of subjects based on their gene expression of IP metabolism (M129). The clusters are color coded in the same way as for E–F). The expression of plasma cell signature genes (M156.1) is shown in the two heat maps on the bottom. Each column corresponds to a subject, matched in all three heat maps. The outliers in C are colored in orange, shown to the top of gene heat maps. E–F) Boxplots for the clusters in D). The p-values are given by Student’s t-test comparing clusters L2 (low) and H5 (high in IP metabolism). G) Association of all nodes (including unconnected nodes) in the full MMRN network with sex, age (young vs elderly), and IP groups (low vs high). The p-values on Y-axis are based on the GSA query method.

References

    1. Abendroth A, Kinchington PR, Slobedman B. Varicella zoster virus immune evasion strategies. Curr Top Microbiol Immunol. 2010;342:155–171. - PMC - PubMed
    1. Akondy RS, Monson ND, Miller JD, Edupuganti S, Teuwen D, Wu H, Quyyumi F, Garg S, Altman JD, Del Rio C, et al. The yellow fever virus vaccine induces a broad and polyfunctional human memory CD8+ T cell response. Journal of immunology. 2009;183:7919–7930. - PMC - PubMed
    1. Bartel J, Krumsiek J, Schramm K, Adamski J, Gieger C, Herder C, Carstensen M, Peters A, Rathmann W, Roden M, et al. The Human Blood Metabolome-Transcriptome Interface. PLoS genetics. 2015;11:e1005274. - PMC - PubMed
    1. Ben-Dor A, Shamir R, Yakhini Z. Clustering gene expression patterns. Journal of computational biology : a journal of computational molecular cell biology. 1999;6:281–297. - PubMed
    1. Bensinger SJ, Bradley MN, Joseph SB, Zelcer N, Janssen EM, Hausner MA, Shih R, Parks JS, Edwards PA, Jamieson BD, et al. LXR signaling couples sterol metabolism to proliferation in the acquired immune response. Cell. 2008;134:97–111. - PMC - PubMed