. 2017 Sep:105:1-14.
doi: 10.1016/j.nbd.2017.05.006. Epub 2017 May 11.

Gene co-expression networks identify Trem2 and Tyrobp as major hubs in human APOE expressing mice following traumatic brain injury

Affiliations

Gene co-expression networks identify Trem2 and Tyrobp as major hubs in human APOE expressing mice following traumatic brain injury

Emilie L Castranio et al. Neurobiol Dis. 2017 Sep.

Abstract

Traumatic brain injury (TBI) is strongly linked to an increased risk of developing dementia, including chronic traumatic encephalopathy and possibly Alzheimer's disease (AD). APOEε4 allele of human Apolipoprotein E (APOE) gene is the major genetic risk factor for late onset AD and has been associated with chronic traumatic encephalopathy and unfavorable outcome following TBI. To determine if there is an APOE isoform-specific response to TBI we performed controlled cortical impact on 3-month-old mice expressing human APOE3 or APOE4 isoforms. Following injury, we used several behavior paradigms to test for anxiety and learning and found that APOE3 and APOE4 targeted replacement mice demonstrate cognitive impairments following moderate TBI. Transcriptional profiling 14days following injury revealed a significant effect of TBI, which was similar in both genotypes. Significantly upregulated by injury in both genotypes were mRNA expression and protein level of ABCA1 transporter and APOJ, but not APOE. To identify gene-networks correlated to injury and APOE isoform, we performed Weighted Gene Co-expression Network Analysis. We determined that the network mostly correlated to TBI in animals expressing both isoforms is immune response with major hub genes including Trem2, Tyrobp, Clec7a and Cd68. We also found a significant increase of TREM2, IBA-1 and GFAP protein levels in the brains of injured mice. We identified a network representing myelination that correlated significantly with APOE isoform in both injury groups. This network was significantly enriched in oligodendrocyte signature genes, such as Mbp and Plp1. Our results demonstrate unique and distinct gene networks at this acute time point for injury and APOE isoform, as well as a network driven by APOE isoform across TBI groups.

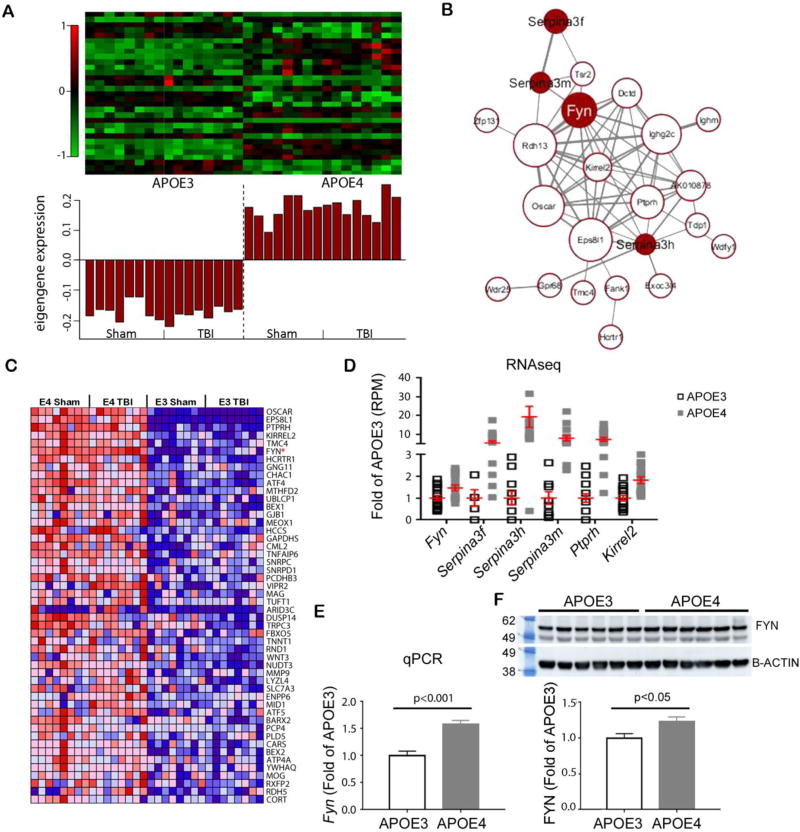
Keywords: Apolipoprotein E; Fyn; Immune response; Innate immune response; Myelination; Traumatic brain injury; Trem2; Tyrobp.


Conflict of interest statement

Conflict of Interest: The authors declare that they have no conflict of interest.

Figures

Fig. 1
Fig. 1
TBI significantly affected behavior performance in mice expressing human APOE3 and APOE4 isoforms. Three months old APOE3 and APOE4 targeted replacement mice underwent CCI and their behavior performance was tested using Elevated Plus Maze (A) and Morris Water Maze (B) paradigms. (A) EPM was performed 4 days post injury. For both APOE isoforms, TBI significantly increased the time spent in the open arms of the maze compared to sham (p<0.0001). Statistics is by two-way ANOVA. There is no interaction between genotype and injury but there are significant main effects of genotype (F(1,53) = 4.967, p=0.03) and injury (F(1,53) = 26.36, p<0.0001). Sidak’s multiple comparison test showed a significant difference between APOE3-Sham vs APOE3-TBI (p<0.05) and APOE4-Sham vs APOE4-TBI (p<0.001). (B) Acquisition of spatial memory was examined in APOE3 (blue) and APOE4 mice (red) on 7–11 days post injury by MWM. Time to find the hidden platform is shown for all days of training. Statistics is by three-way ANOVA. There was no interaction between any of the factors, but significant main effects of all three, training, injury and genotype. (For training: F(4,4) = 21.35, p<0.0001; for injury: F(1,4) = 59.94, p<0.0001; for genotype: F(1,4) =17.8, p<0.0001)
Fig. 2
Fig. 2
TBI significantly affected the transcriptome demonstrating increases in immune response and decreases in neuronal functionality. mRNA-seq was performed on RNA isolated from the hippocampi and cortex of APOE3 and APOE4 mice shown on Fig. 1, N=8 mice per group. (A) Principle component analysis used to calculate the principal components that account for the highest possible variance in the transcriptome. N= 8 mice/group and all transcripts from each mouse. PCA plot of the transcriptome shows distinct separation based on TBI but not on APOE isoform. (B) Scatterplot for genes comparing sham and TBI reads per million. (C–D) Volcano plots representing the mRNA-seq results. Differential gene expression analysis between sham and injured mice using EdgeR identified: in APOE3 (C): 2853 up- (red) and 2307 down-regulated genes by TBI (blue), and in APOE4 (D): 2065 up- and 1045 down-regulated genes at p<0.05 cutoff. For C and D, statistics is by edgeR, p<0.05. (E) Western blot results for APOE3 sham versus TBI animals for ABCA1, CLU, APOE, and β-ACTIN validate mRNA-seq results. (F) Western blot results for APOE4 sham versus TBI animals for ABCA1, CLU, APOE, and β-ACTIN validate mRNA-seq results. Proteins are normalized to levels of β-ACTIN.
Fig. 3
Fig. 3
mRNA-seq data reveal that microglia are predominant source of inflammation. Average expression according to mRNA-seq results for several inflammatory markers modulated by TBI were calculated as the fold of Sham reads per million for each gene. (A–B) Several microglial specific transcripts are significantly upregulated by TBI in both (A) APOE3 and (B) APOE4 mice. (C–D) Purinergic receptors in (C) APOE3 and (D) APOE4 mice, as well as (E–F) Siglecs in (E) APOE3 and (F) APOE4 mice were also upregulated following TBI. Statistics is by edgeR; *p<0.05, **p<0.01, ***p<0.001.
Fig. 4
Fig. 4
WGCNA identified modules that correlated to TBI and or APOE isoform. WGCNA was used to determine the correlation of module eigengenes to Injury and APOE genotype. Each cell shows the correlation between the module eigengene (rows) and group (columns) with p-value. Red denotes a positive and blue is a negative correlation. Modules of interest are differentially expressed between trait conditions. Brown, and Green are modules associated with TBI, Darkred and Salmon – with APOE genotype.
Fig. 5
Fig. 5
ME Brown correlates to TBI and is associated with Immune Response. (A) Expression barplot shows the gene expression and eigengene expression within each sample. Within the heatmap, the rows denote genes and the columns correspond to samples, with the corresponding module eigengene value for each sample shown in the bar plot below. Red denotes over-expression and green under-expression of the gene within the sample. (B) Network of genes connected to hub genes Trem2, Tyrobp, Clec7a, Cd68, Cx3cr1 representing immune response. Size of each gene was determined by modular membership value, and the weight determined edge width. (C–D) Average expression according to mRNA-seq results of genes modulated by TBI in “Immune response” category for (C) APOE3 and (D) APOE4 mice. The average expression was calculated as fold of Sham reads per million for each gene. Statistics is by edgeR, p<0.05. (E–F) Validation of mRNA-seq results for Trem2, Tyrobp, Cx3cr1, Tgfb1, Tgfbr1 for (E) APOE3 and (F) APOE4 mice by qPCR. Statistics was determined by t-test.
Fig. 6
Fig. 6
TREM2 protein level and Astrocytosis are increased by TBI. Immunohistochemistry with anti-TREM2 antibody or anti-GFAP was performed in both sham and TBI mice (n=3/group). Percent intensity of Trem2 staining or GFAP staining was determined in the ipsilateral hemispheres. (A) Sham animals had low to no levels in Trem2. (B) APOE3 TBI and (C) APOE4 TBI animals had significantly higher levels of Trem2 when compared to their sham counterparts (p<0.01 for both APOE3 and APOE4). (D) Analysis of object area fraction demonstrates a significant main effect of injury (p<0.001), but not APOE isoform in Trem2 levels. Statistics is by Two-way ANOVA with post-hoc Tukey’s multiple comparisons test. (E) Sham animals demonstrated low GFAP staining levels. (F) APOE3 and (G) APOE4 TBI animals show increased GFAP staining compared to their sham counterparts, particularly near the injury site (APOE3: p<0.01; APOE4: p<0.001). Insets taken from the injury visualize the increased staining at higher magnification (20X). (H) Analysis of object area fraction demonstrates a significant main effect of injury (p<0.001), but not APOE isoform in GFAP levels. There was no significant difference between APOE3 and APOE4 animals, regardless of injury. Statistics is by Two-way ANOVA with post-hoc Tukey’s multiple comparisons test.
Fig. 7
Fig. 7
ME darkred correlates to APOE isoform and is associated with innate immunity. (A) The expression bar plot shows the gene expression and eigengene expression within each sample. (B) Network of genes connected to the chosen hub gene Fyn representing innate immunity. (C) Heatmap of top 50 upregulated genes in comparing APOE3 to APOE4 mice. (D) mRNA-seq results for important genes within the network. The average expression was calculated as fold of APOE3 reads per million for each gene. Statistics is by edgeR, p<0.05. (E) Validation of mRNA-seq results by qPCR. Statistics was determined by t-test. (F) Western blot results for APOE3 TBI versus APOE4 TBI animals for FYN and β-ACTIN validate mRNA-seq results. Proteins are normalized to levels of β-ACTIN and presented as fold of APOE3.
Fig. 8
Fig. 8
Gene-network module salmon correlates to APOE isoform in injury groups and is associated with myelination. (A) The expression barplot shows the gene expression and eigengene expression within each sample. (B) Network of genes connected to hub genes Car2, F2ah, Mbp and Plp1 representing myelination. (C) mRNA-seq results for important genes within the network. The average expression was calculated as fold of APOE3 TBI reads per million for each gene. Statistics is by edgeR, p<0.05. (D) Validation of mRNA-seq results by qPCR for Mbp and Plp1. The average expression was calculated as fold of all APOE3 TBI mice. Statistics was determined by t-test.

Similar articles

Cited by

References

    1. Abraham CR. Reactive astrocytes and alpha1-antichymotrypsin in Alzheimer’s disease. Neurobiol Aging. 2001;22:931–936. - PubMed
    1. Acosta SA, Tajiri N, Shinozuka K, Ishikawa H, Grimmig B, Diamond DM, Diamond D, Sanberg PR, Bickford PC, Kaneko Y, Borlongan CV. Long-term upregulation of inflammation and suppression of cell proliferation in the brain of adult rats exposed to traumatic brain injury using the controlled cortical impact model. PloS one. 2013;8:e53376–e53376. - PMC - PubMed
    1. Alderson NL, Maldonado EN, Kern MJ, Bhat NR, Hama H. FA2H-dependent fatty acid 2-hydroxylation in postnatal mouse brain. J Lipid Res. 2006;47:2772–2780. - PubMed
    1. Alexander S, Kerr ME, Kim Y, Kamboh MI. Apolipoprotein E4 allele presence and functional outcome after severe traumatic brain injury. Journal of Neurotrauma. 2007;24:790–797. - PubMed
    1. Bennett RE, Esparza TJ, Lewis HA, Kim E, Mac Donald CL, Sullivan PM, Brody DL. Human apolipoprotein E4 worsens acute axonal pathology but not amyloid-beta immunoreactivity after traumatic brain injury in 3xTG-AD mice. J Neuropathol Exp Neurol. 2013;72:396–403. - PMC - PubMed

MeSH terms