. 2017 Jan-Mar;15(1):943.
doi: 10.18549/PharmPract.2017.01.943. Epub 2017 Mar 15.

Network meta-analysis: a technique to gather evidence from direct and indirect comparisons

Affiliations

Network meta-analysis: a technique to gather evidence from direct and indirect comparisons

Fernanda S Tonin et al. Pharm Pract (Granada). 2017 Jan-Mar.

Abstract

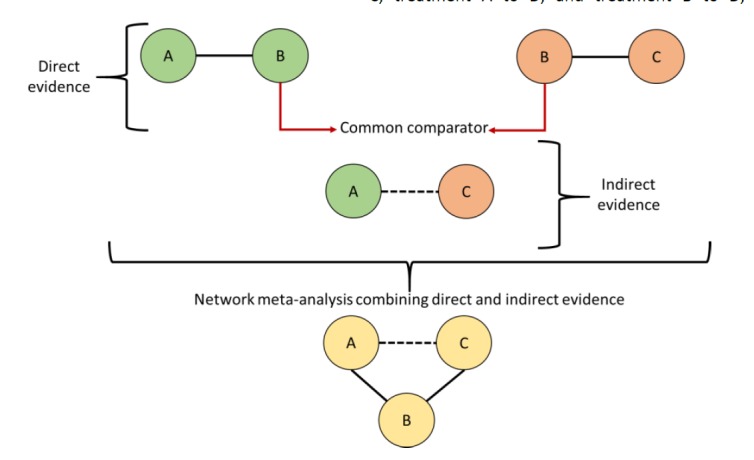
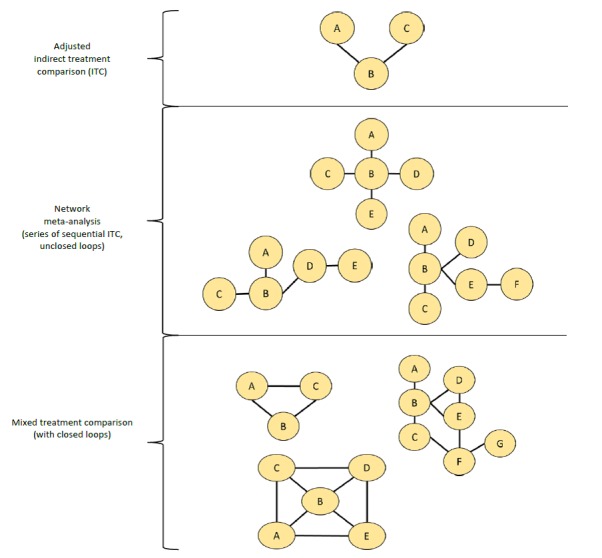
Systematic reviews and pairwise meta-analyses of randomized controlled trials, at the intersection of clinical medicine, epidemiology and statistics, are positioned at the top of evidence-based practice hierarchy. These are important tools to base drugs approval, clinical protocols and guidelines formulation and for decision-making. However, this traditional technique only partially yield information that clinicians, patients and policy-makers need to make informed decisions, since it usually compares only two interventions at the time. In the market, regardless the clinical condition under evaluation, usually many interventions are available and few of them have been studied in head-to-head studies. This scenario precludes conclusions to be drawn from comparisons of all interventions profile (e.g. efficacy and safety). The recent development and introduction of a new technique - usually referred as network meta-analysis, indirect meta-analysis, multiple or mixed treatment comparisons - has allowed the estimation of metrics for all possible comparisons in the same model, simultaneously gathering direct and indirect evidence. Over the last years this statistical tool has matured as technique with models available for all types of raw data, producing different pooled effect measures, using both Frequentist and Bayesian frameworks, with different software packages. However, the conduction, report and interpretation of network meta-analysis still poses multiple challenges that should be carefully considered, especially because this technique inherits all assumptions from pairwise meta-analysis but with increased complexity. Thus, we aim to provide a basic explanation of network meta-analysis conduction, highlighting its risks and benefits for evidence-based practice, including information on statistical methods evolution, assumptions and steps for performing the analysis.

Keywords: Decision Support Techniques; Evidence-Based Practice; Network Meta-Analysis; Treatment Outcome.


Conflict of interest statement

CONFLICT OF INTEREST None.

Figures

Figure 1
Figure 1
Example of pairwise meta-analyses. In the literature we can found RCT directly comparing interventions (e.g. A versus B in green; and B versus C in orange). Each RCT produce an effect in the meta-analyses (e.g. odds ratio, risk ratio, mean difference) represented by the lines in the graph and a global effect measure (diamond) that represents the reunion of the effects of the included studies. However, in this model is not possible to compare interventions A and C.
Figure 2
Figure 2
Direct and indirect evidence. In the literature we can found RCT directly comparing interventions (e.g. A versus B in green; and B versus C in orange). Each circle represents an intervention and lines represent direct comparisons. Dashed lines are for indirect comparison. An global effect value is generated for each comparison (direct or indirect). Indirect evidence is generated by using B as common comparator for the comparison of A versus C (model proposed by Bucher). Network meta-analysis combining both direct and indirect evidence may be built.
Figure 3
Figure 3
Network diagrams and definitions (Examples of networks geometries and evolution of statistical concepts). First panel: Adjusted Indirect Treatment Comparison (ITC) proposed by Bucher (simple indirect comparison); Second Panel: Network meta-analysis proposed by Lumley (open loops meta-analysis); Third Panel: Mixed Treatment Comparison proposed by Lu and Ades as an improvement of Network meta-analysis from Lumley. Together, these meta-analytical process are also called “network meta-analysis” and cover direct and indirect comparisons in the same model.
Figure 4
Figure 4
Network diagram – basic components. A network is composed by at least three nodes (interventions or comparators) connected by lines (direct comparisons). In this diagram, lines width is proportional to the number of direct evidence available in the literature. Closed loops may be formed according to the availability of direct and indirect evidence on the literature (e.g. B vs. C vs. E vs. F represent a closed loop; B vs. D vs. E is another closed loop). Indirect evidence is calculated using a common comparator (e.g. estimations between A and D are made through B; estimations between E and G are made through F).
Figure 5
Figure 5
Tables with results of MTC analyses: pooled effect sizes for the outcomes of efficacy (e.g. cure of a disease). On the right, the network plot shows four interventions and a placebo. Intervention D and placebo act as common comparators. On the left, in the consistency table, drugs are reported alphabetically. Comparisons between treatments should be read from left to right (i.e. treatment 1 versus treatment 2). The estimate effect measure (e.g. odds ratio – OR followed by 95% CrI) is in the cell in common between the row-defining treatment and column-defining treatment. Values of OR higher than 1 favour the occurrence of the outcome in the defined-treatment 1. Values of OR lower than 1 favour the outcome to the defined-treatment 2. Significant results are in bold and underlined. For instance, A versus B value is 1.12 (0.31-3.44) and interventions have no significant differences. A versus D value is 1.72 (1.05-2.91), favouring intervention A as most effective.
Figure 6
Figure 6
Rank probabilities representations. For a network with five nodes (A, B, C, D and placebo), after the interpretation of the model of consistency (figure 5), we can order the intervention using different tools (graphics, tables). In each one of them, the probabilities of each intervention to be the best (1st in the rank), second best, third, fourth and last in the rank (5th position - worst therapy) are calculated. First panel: probabilities are given such as percentages. Rank probabilities sum to one, both within a rank over treatments (horizontal) and within a treatment over ranks (columns). Intervention A has 46% (0.46) of probability of being the best drug (first in the rank), followed by C (48%), D (44%), B (49%) and placebo (85%). This same scenario is presented in the second panel and third panels (as a graphic illustration) where each intervention has a probability to be part of the first, second, third, fourth, fifth positions.

References

    1. Jansen JP, Naci H. Is network meta-analysis as valid as standard pairwise meta-analysis? It all depends on the distribution of effect modifiers. BMC Med. 2013;11:159. doi: 10.1186/1741-7015-11-159. - PMC - PubMed
    1. Jansen JP, Trikalinos T, Cappelleri JC, Daw J, Andes S, Eldessouki R, Salanti G. Indirect treatment comparison/network meta-analysis study questionnaire to assess relevance and credibility to inform health care decision making: an ISPOR-AMCP-NPC Good Practice Task Force report. Value Health. 2014;17(2):157–173. doi: 10.1016/j.jval.2014.01.004. - PubMed
    1. Bafeta A, Trinquart L, Seror R, Ravaud P. Analysis of the systematic reviews process in reports of network meta-analyses: methodological systematic review. BMJ. 2013;347:f3675. doi: 10.1136/bmj.f3675. - PMC - PubMed
    1. Bafeta A, Trinquart L, Seror R, Ravaud P. Reporting of results from network meta-analyses: methodological systematic review. BMJ. 2014;348:g1741. doi: 10.1136/bmj.g1741. - PMC - PubMed
    1. Caldwell DM, Dias S, Welton NJ. Extending treatment networks in health technology assessment: how far should we go? Value Health. 2015;18(5):673–681. doi: 10.1016/j.jval.2015.03.1792. - PMC - PubMed

LinkOut - more resources