. 2017 May 15:8:15014.
doi: 10.1038/ncomms15014.

Actomyosin meshwork mechanosensing enables tissue shape to orient cell force

Affiliations

Actomyosin meshwork mechanosensing enables tissue shape to orient cell force

Soline Chanet et al. Nat Commun. .

Abstract

Sculpting organism shape requires that cells produce forces with proper directionality. Thus, it is critical to understand how cells orient the cytoskeleton to produce forces that deform tissues. During Drosophila gastrulation, actomyosin contraction in ventral cells generates a long, narrow epithelial furrow, termed the ventral furrow, in which actomyosin fibres and tension are directed along the length of the furrow. Using a combination of genetic and mechanical perturbations that alter tissue shape, we demonstrate that geometrical and mechanical constraints act as cues to orient the cytoskeleton and tension during ventral furrow formation. We developed an in silico model of two-dimensional actomyosin meshwork contraction, demonstrating that actomyosin meshworks exhibit an inherent force orienting mechanism in response to mechanical constraints. Together, our in vivo and in silico data provide a framework for understanding how cells orient force generation, establishing a role for geometrical and mechanical patterning of force production in tissues.


Conflict of interest statement

The authors declare no competing financial interests.

Figures

Figure 1
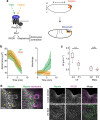
Figure 1. Tissue shape defines the direction of tension.
(a, top) Schematic representation of a gastrulating Drosophila embryo; the prospective mesoderm is depicted in green. Anisotropic epithelial tension (red arrows) accompanies ventral furrow formation. Tension is predominantly directed along the a-p axis, whereas there is more movement or tissue flow (blue arrows) in the d-v direction towards the ventral midline. (a, bottom) The VF domain (green) consists of a ventral rectangle defined by the expression pattern of Twist and Snail. (b, top) Depletion of Spn27A activity in the early embryo increases the number of cells adopting the ventral fate, marked by Snail expression (green), around the embryo circumference. (b, bottom) Fat2 depletion in the female ovary inhibits oocyte elongation and leads to the formation of round eggs. (c) Initial recoil velocity was measured along a-p after vertical line incision (yellow line) and along d-v after horizontal line incision. Images are a representative example from live embryos before (0 s) and 3 s after line ablation performed in Ctr-RNAi embryos expressing sqh::GFP (myosin, green). (d) Box-and-whisker plot of initial recoil velocity (v0) along a-p and d-v, measured after line ablation performed in Ctr-RNAi (n=15 vertical incisions and n=9 horizontal incisions), Spn27A-RNAi (n=24 vertical incisions and n=9 horizontal incisions) and Fat2-RNAi (n=19 vertical incisions and n=11 horizontal incisions) embryos. ***P<0.001, n.s., not significant, t-test. (e) Images from live embryos injected with arm double-stranded RNA (arm-RNAi) to lower junctional complexes (top panels) in Ctr-RNAi, Spn27A-RNAi and Fat2-RNAi embryos. The arm-RNAi resulted in tissue tearing and separation of the myosin meshwork (green). Yellow lines highlight the direction of the tears. The angles between the tears and the a-p axis were quantified (lower panels). Angle repartitions are significantly different in Spn27A-RNAi (n=26 tears, 3 embryos) and Fat2-RNAi (n=22 tears, 3 embryos) compared with Ctr-RNAi embryos (n=13 tears, 3 embryos). **P<0.01, ***P<0.001, t-test. Scale bars, 40 μm (a,e) and 10 μm (c). All images of en face views show the ventral side of the embryos, and anterior is left and posterior is right.
Figure 2
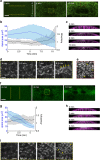
Figure 2. Tissue shape is critical for proper cell shape changes.
(a) Mean apical cell area over time calculated for Ctr-RNAi (n=119 cells, 2 embryos), Spn27A-RNAi (n=134 cells, 2 embryos) and Fat2-RNAi (n=418 cells, 3 embryos) embryos during VF formation. Shaded area indicates s.d. (b) Images of VF cell outlines in live embryos depleted for the indicated gene before and 5 min after the onset of cell constrictions. (c) Box-and-whisker plots of cell anisotropy 7 min after the onset of cell constriction for the embryos analysed in a. Cell anisotropy is the length of the cell along the horizontal axis divided by the vertical length, such that cells elongated along the a-p axis exhibit anisotropy >1. Isotropic is anisotropy=1. (d) Injection of arm-RNAi locally induced tissue tears (dotted lines) that disrupted tissue integrity. Cell constriction was followed for cells between tears (asterisks). (e) Mean apical area over time for 16 Ctr-RNAi, 18 Spn27A-RNAi and 15 Fat2-RNAi constricting cells between tears after arm-RNAi injection. Shaded area indicates s.d. Scale bars, 10 μm. ***P<0.001, t-test.
Figure 3
Figure 3. Change in tissue shape induces alternative configuration of the ROCK-myosin signalling module.
(a) Apical myosin meshwork (green) organized into a-p oriented fibres during VF formation in Ctr-RNAi embryos (arrows) but organized into rings in Spn27A-RNAi and Fat2-RNAi embryos (arrows). Red arrowheads point to radially oriented spokes that connected myosin rings from cell to cell. a, anterior; p, posterior. (b) Images of VF cells in fixed wild-type and Spn27A-RNAi embryos showing the localization of ROCK::GFP (green) sqh::mCherry (blue) and MBS (red). Myosin and MBS formed a fibrous network and ROCK a condensed focus in wild-type cells (arrow), whereas Myosin, MBS and ROCK organized into rings in Spn27A-RNAi cells (arrow). (c,d) Quantification of ROCK, myosin and MBS polarization in the apical domain of VF cells as the signal intensity profile from the centre of ROCK density to the apical margin. Left, schematic of cells with radial lines emanating from the ROCK centre of mass. Right, mean normalized intensity profile of ROCK, myosin and MBS in wild-type cells (c, n=152 cells, one embryo) and Spn27A-RNAi cells with clear ROCK rings (d, n=27 cells, one embryo). Shaded area indicates s.d. Scale bars, 5 μm (a) and 10 μm (b).
Figure 4
Figure 4. Actomyosin meshworks respond to mechanical constraints.
(a) Images from live Spn27A-RNAi embryos showing myosin organization (green), while two horizontal incisions of 60 μm long (yellow lines) were performed repetitively using a 2-photon laser to lower resistance along the d-v axis. (b) Mean apical cell area (blue) and anisotropy (black) over time for 45 cells located in between two horizontal incisions in a Spn27-RNAi embryo. Shaded area indicates s.d. (c) YZ cross-section view of the same embryo used for quantification in b. The wedge-shape of the two medial-most invaginating cells is highlighted with white dotted lines. (d) Time-lapse images showing myosin fibre formation over time in the region within the yellow dotted box depicted in a, middle panel. (e) Higher magnification of region within the red dotted box in a, right panel, showing myosin rings (arrows) in a region outside of the horizontal cuts. (f) Images from live Ctr-RNAi embryos showing myosin organization (green), while two vertical incisions of 50 μm long (yellow lines) were performed repetitively using a 2-photon laser to reduce resistance to contract along the a-p axis. (g) Mean apical cell area (blue) and anisotropy (black) over time for 65 medial cells located between two vertical incisions in a Ctr-RNAi embryo. Shaded area indicates s.d. (h) YZ cross-section view of the same embryo as in g. The final shape of the constricting cells is highlighted with white dotted lines. (i) Time-lapse images showing myosin ring formation over time in the region within the yellow dotted box depicted in f, middle panel. Scale bars, 20 μm (a,f) and 5 μm (d,i).
Figure 5
Figure 5. 2D in silico actomyosin cortex predicts that external constraints alter cytoskeleton organization and force direction.
(a) F-actin is modelled by polar filaments (red) and motors by springs (green). As motor exerts force on filaments, filaments translocate and/or rotate. (b) Within a perimeter of 0.5 filament length, the plus ends of the filaments are caught by springs with defined stiffness to model boundary resistance. (c, left) To simulate isotropic constraints, boundary springs (stiffness=100 kPa) were equally distributed around the boundary. To simulate anisotropic constraints, softer springs (20 kPa) were placed at the top and bottom of the boundary. The rose diagrams illustrate the average force generated on boundary springs for each condition (n≥;10 simulations), and circle divisions represent 10 nN. (Right) The ratio of force production along stiff (left/right) over soft (top/bottom) axes was calculated and plotted depending on increasing values of stiffness anisotropy between left/right and top/bottom boundary springs; n≥;10 simulations per conditions. Error bars represent s.d. (d) Kymographs representing the contraction of the network into an aster (top) or the stabilization of a ring-like structure (bottom) depending on the resistance of the boundary. (e) Images of representative simulations at two time points showing motor (green) and actin filament (red) organization. The associated rose diagram illustrates forces generated on the boundary by these networks, and circle divisions represent 10 nN. Top, isotropic boundary. Bottom, anisotropic boundary. (f) Motor alignment for simulations with isotropic or anisotropic boundaries (t=250 time-steps). The motors are colour coded based on angle relative to the horizontal axis, with red motors being most aligned with that axis. Anisotropic boundary constraints resulted in motors aligned with the stiff (horizontal) axis along the top and bottom of the oval-like myosin structure (arrows). Quantification of motor alignment is given in the table. Numbers highlighted in grey correspond to the isotropic case and numbers highlighted in purple to the anisotropic case. There is a 20% enrichment bias in motors aligned along the stiff horizontal axis when the resistance of the boundary is anisotropic. (g) Model illustrating the factors that influence motor movement and alignment, and force production in response to asymmetric boundary stiffness.
Figure 6
Figure 6. Cup-like invagination of the posterior midgut is associated with actomyosin rings and isotropic tension.
(a) Apical constriction is activated downstream of the Fog pathway in VF cells (where Fog is transcriptionally activated by Twist) and PMG cells (where Fog is transcriptionally activated by Tailless). PMG formation is driven by apical constriction of the posterior–dorsal cells forming a cup-like invagination. (b) Mean apical area (left) and anisotropy (right) over time during VF (green, n=119 cells, 2 embryos) and PMG (orange, n=188 cells, 3 embryos) formation. PMG cells constrict isotropically. Shaded area indicates s.d. (c) Box-and-whisker plot of initial recoil velocity (v0) along a-p and d-v, measured after line ablation performed in the VF (n=15 vertical incisions and n=9 horizontal incisions) and the PMG (n=7 vertical incisions and n=7 horizontal incisions). ***P<0.001, n.s., not significant, t-test. (d) Left panels are fixed images of wild-type PMG cells, showing apical myosin organization in rings (arrows). Staining for subapical actin delineated cell boundaries. (d, right) Images of cross-section and en face views of PMG cells from a live embryo expressing ROCK-GFP (magenta) and sqh::mCherry (green). Scale bars, 10 μm (right panels) and 20 μm (left panels).
Figure 7
Figure 7. Model: tissue shape orients actomyosin meshworks and tension to generate specific tissue forms.
Tissue shape and geometry impose mechanical constraints to deformation. For example, the rectangular shape of the VF means that more cells generate tension (red arrows) and resist constriction along the long a-p axis than the short d-v axis, whereas the more isotropic domain of the presumptive PMG imposes isotropic constraints. Actomyosin meshworks sense and respond to these constraints by adopting different configurations (that is, rings or fibres). The meshwork configuration, in turn, could orient cell force generation. The combination of tissue geometry and cell force directionality then governs the final tissue form.

Similar articles

Cited by

References

    1. Reymann A. C. et al.. Actin network architecture can determine myosin motor activity. Science 336, 1310–1314 (2012). - PMC - PubMed
    1. Vignaud T. et al.. Reprogramming cell shape with laser nano-patterning. J. Cell Sci. 125, 2134–2140 (2012). - PubMed
    1. Théry M., Pépin A., Dressaire E., Chen Y. & Bornens M. Cell distribution of stress fibres in response to the geometry of the adhesive environment. Cell Motil. Cytoskeleton 63, 341–355 (2006). - PubMed
    1. Oakes P. W., Banerjee S., Marchetti M. C. & Gardel M. L. Geometry regulates traction stresses in adherent cells. Biophys. J. 107, 825–833 (2014). - PMC - PubMed
    1. Bieling P. et al.. Force feedback controls motor activity and mechanical properties of self-assembling branched actin networks. Cell 164, 115–127 (2016). - PMC - PubMed

Publication types