. 2017 May 15:8:15300.
doi: 10.1038/ncomms15300.

Low phosphate activates STOP1-ALMT1 to rapidly inhibit root cell elongation

Affiliations

Low phosphate activates STOP1-ALMT1 to rapidly inhibit root cell elongation

Coline Balzergue et al. Nat Commun. .

Abstract

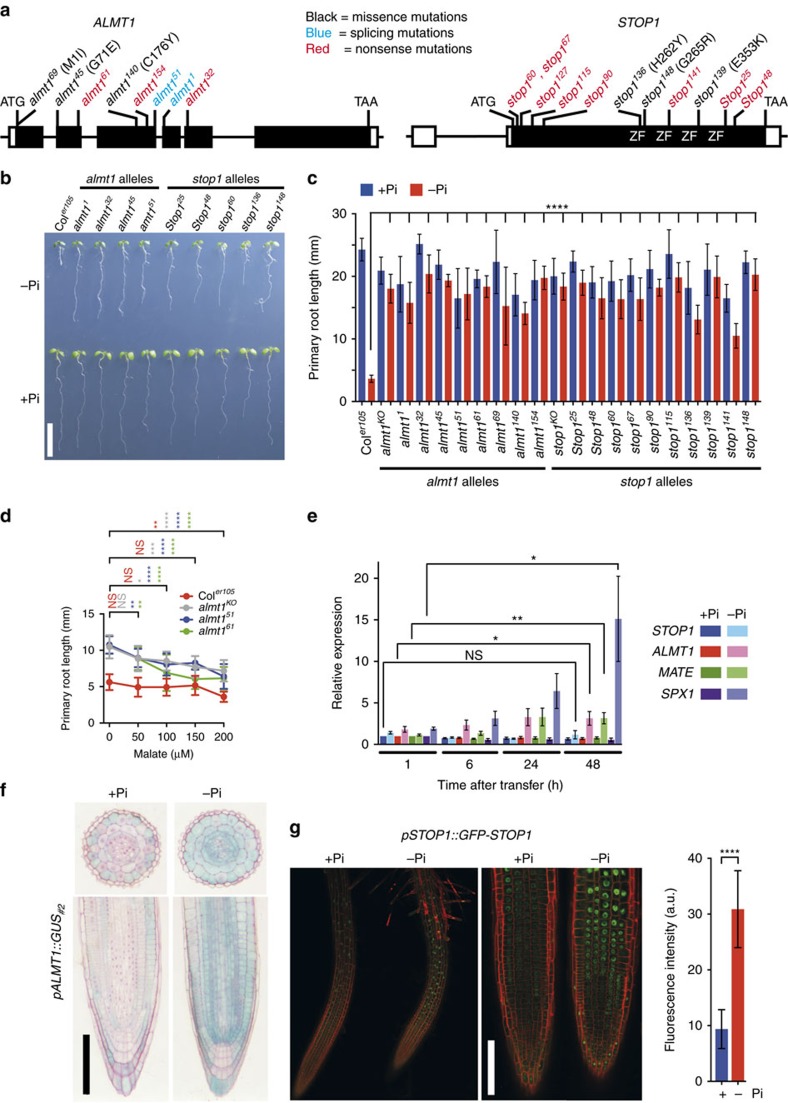
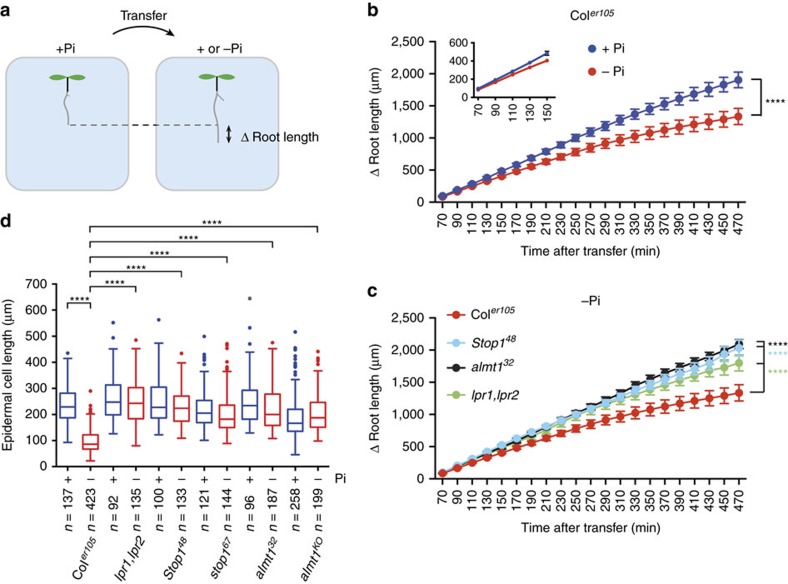
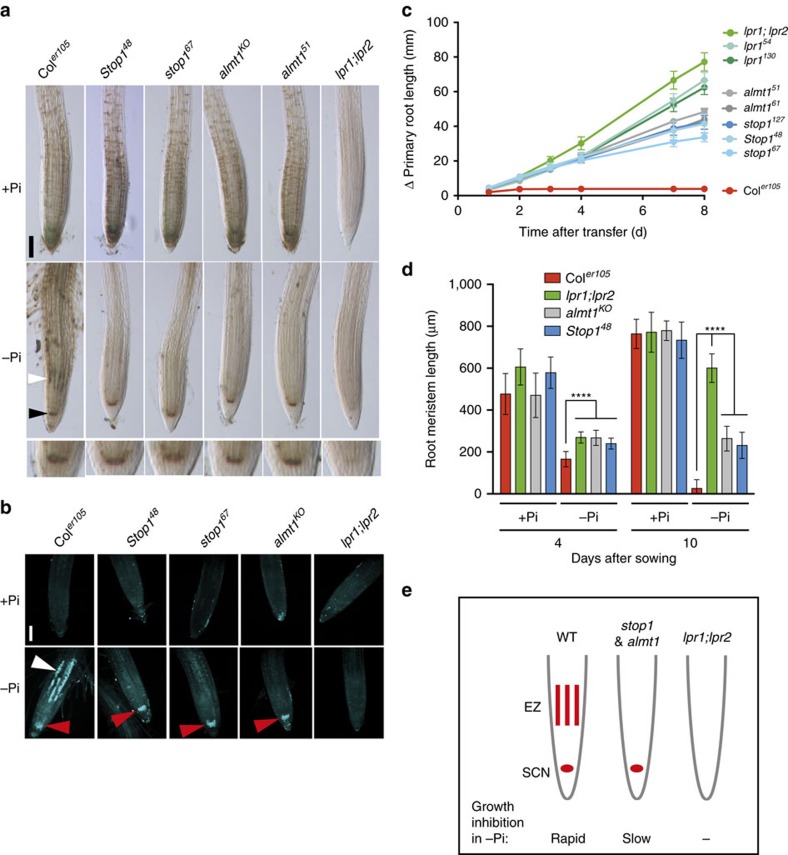
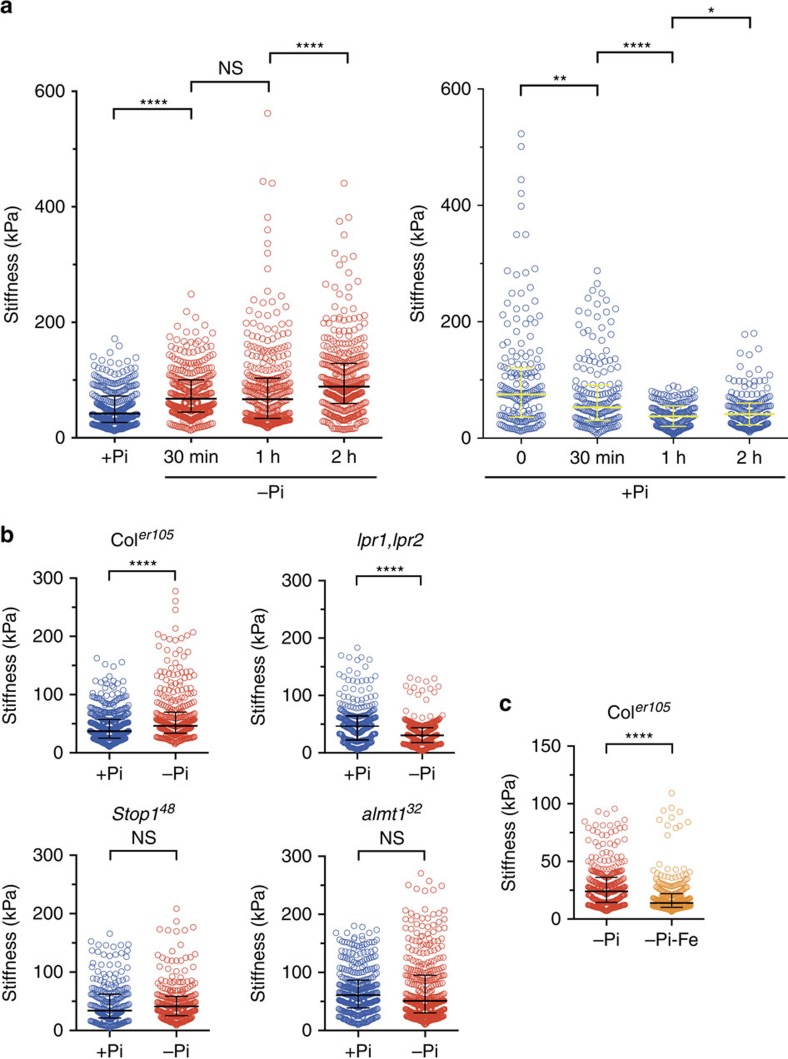
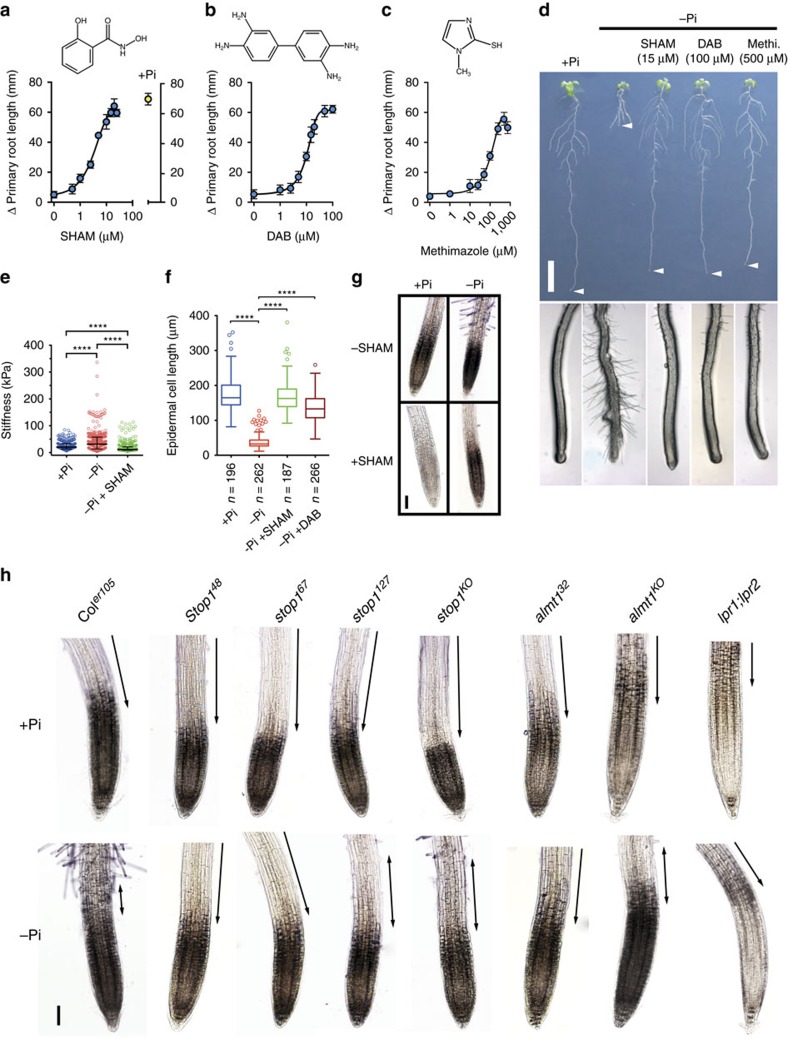
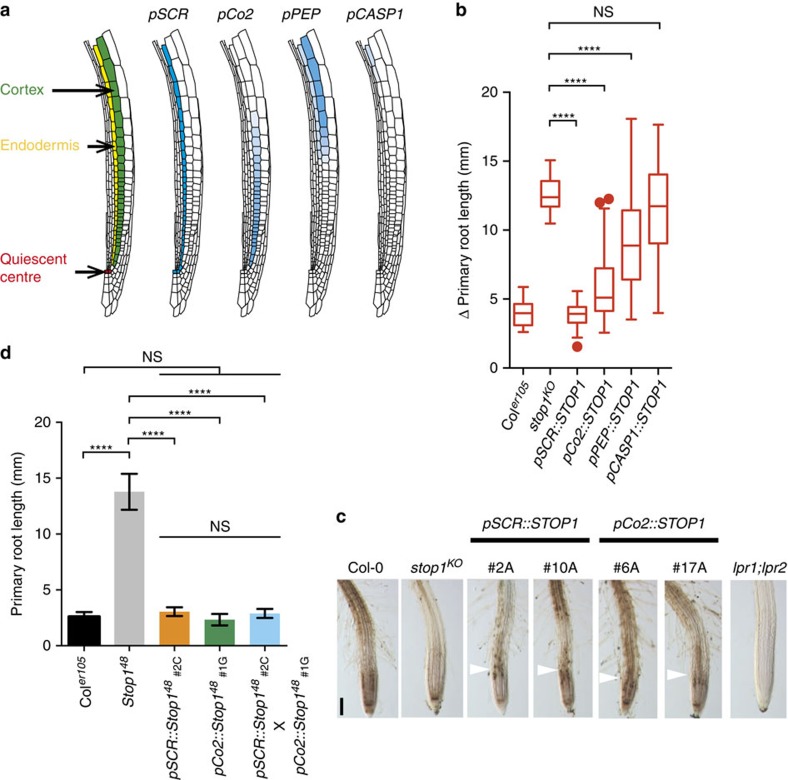
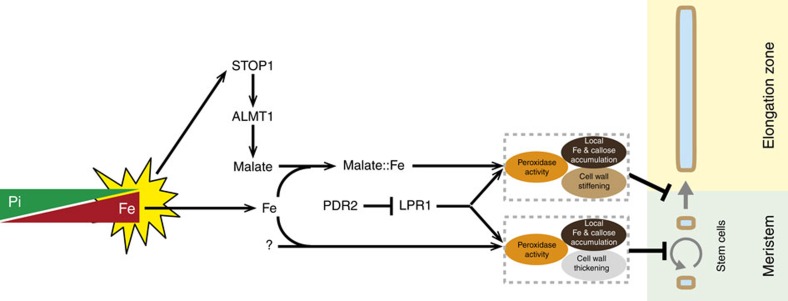
Environmental cues profoundly modulate cell proliferation and cell elongation to inform and direct plant growth and development. External phosphate (Pi) limitation inhibits primary root growth in many plant species. However, the underlying Pi sensory mechanisms are unknown. Here we genetically uncouple two Pi sensing pathways in the root apex of Arabidopsis thaliana. First, the rapid inhibition of cell elongation in the transition zone is controlled by transcription factor STOP1, by its direct target, ALMT1, encoding a malate channel, and by ferroxidase LPR1, which together mediate Fe and peroxidase-dependent cell wall stiffening. Second, during the subsequent slow inhibition of cell proliferation in the apical meristem, which is mediated by LPR1-dependent, but largely STOP1-ALMT1-independent, Fe and callose accumulate in the stem cell niche, leading to meristem reduction. Our work uncovers STOP1 and ALMT1 as a signalling pathway of low Pi availability and exuded malate as an unexpected apoplastic inhibitor of root cell wall expansion.


Conflict of interest statement

The authors declare no competing financial interests.

Figures

Figure 1
Figure 1. Phenotype of almt1 and stop1 mutants and expression of ALMT1.
(a) Position and nature of the almt1 and stop1 mutations. (b) Appearance of representative WT and mutant seedlings after germination and growth for 6 days on +Pi or −Pi medium. (c) Primary root length of WT (Coler105) and mutant seedlings grown for 6 days in +Pi or −Pi conditions. Mean±s.d., n=9–14 seedlings per line and condition; unpaired two-tailed t-test; ****P<0.0001). (d) Malate complementation. WT and almt1 seedlings grown under +Pi for 2 days were transferred for 6 days to −Pi medium with or without the indicated concentrations of malate (mean±s.d., n=7–14 seedlings per condition; two-way ANOVA, ****P<0.0001; ***P<0.001; **P<0.01; *P<0.05; NS, not significant). (e) Gene expression analysis. WT seedlings grown under +Pi for 5 days were transferred to +Pi or −Pi medium for 1–48 h, total root RNA was extracted and expression of the indicated genes analysed by qRT–PCR. SPX1 was used as a positive marker for the −Pi stress. Relative expression levels are normalized to that of the +Pi at 1 h (mean±s.e.m., n=6 independent experiments; unpaired two-tailed t-test; **P<0.01; *P<0.05; NS, not significant). (f) Pattern of ALMT1 expression in primary root tip. Transverse (top) and longitudinal (bottom) sections of the root tip of pALMT1::GUS (WT). Seedlings were grown 5 days under +Pi and transferred to +Pi or −Pi medium for 48 h prior to GUS staining. (g) GFP-fluorescence of GFP-STOP1 in root tips. Four-day-old stop1KO;pSTOP1::GFP-STOP1 (# B10A) seedlings grown under +Pi were transferred to +Pi or −Pi plates for 24 h, and GFP-fluorescence was visualized by confocal microscopy. Left panel: the two roots were mounted side by side on the same microscope slide (× 10 objective). Middle panel: magnification of the root tips (× 20 objective). See also Supplementary Fig. 6c for additional lines. Right panel: intensity of the GFP-fluorescence (a.u., arbitrary units) in nuclei of the root tip (mean±s.d., n=54 and 43 nuclei in + Pi and −Pi, respectively; unpaired two-tailed t-test; ****P<0.0001). Two (c,d,f) or three (g) independent experiments were performed with consistent results and one representative experiment is shown. Scale bars, 1 cm (b), 100 μm (f,g).
Figure 2
Figure 2. Rapid primary root growth arrest under −Pi.
(a) Scheme depicting the Δ primary root length measured in seedlings transferred from a +Pi plate to a +Pi or −Pi medium. (b) Time course of the Δ primary root length of WT seedlings transferred to +Pi or −Pi medium. Inset shows magnification of the first time points. Three independent experiments were performed with consistent results and one representative experiment is shown (mean±s.e.m., n=10 seedlings per condition; two-way ANOVA, multiple comparisons; ****P<0.0001). (c) Time course of the Δ primary root length of WT and mutant seedlings transferred to −Pi. Two independent experiments were performed with consistent results and one representative experiment is shown (mean±s.e.m., n=8–10 seedlings per line and condition; two-way ANOVA, multiple comparisons; ****P<0.0001). (d) Seven-day-old seedlings of the indicated genotype were transferred to +Pi or −Pi medium for 24 h before measuring the final length of root epidermal cells (median±interquartile; Tukey whiskers; Mann–Whitney test: ****P<0.0001; n, number of cells).
Figure 3
Figure 3. The stop1 and almt1 mutations largely uncouple the effects of −Pi on the EZ and RAM.
(a) Fe accumulation and distribution in primary root tips. Three-day-old seedlings of the indicated genotypes were transferred to +Pi or −Pi plates for 48 h prior to Perls/DAB staining. Note the accumulation of Fe in the EZ of the WT (white arrowhead) and in the SCN (black arrowhead). Bottom panel: magnification of the root tip of seedlings under −Pi. Images are representative of three independent experiments. Scale bar, 100 μm. (b) Four-day-old seedlings grown under +Pi were transferred 20 h in +Pi or −Pi before callose staining. The white arrowhead points to callose accumulation in the EZ; the red arrowheads point to callose accumulation in the SCN. Two independent experiments were performed with consistent results and one representative experiment is shown. Scale bar, 100 μm. (c) Time course of the Δ primary root length of WT and mutant seedlings transferred to −Pi. Two independent experiments were performed with consistent results and one representative experiment is shown (mean±s.d., n=8–14 seedlings per line). (d) Primary root meristem length of WT and mutant seedlings grown for 4 or 10 days in +Pi or −Pi medium (mean±s.d., n=14–25 meristems per condition; two-way ANOVA, multiple comparisons; ****P<0.0001). (e) Schematic diagram of the consequences of stop1, almt1 and lpr1;lpr2 mutations on accumulation of Fe and callose, and growth of the primary root under −Pi. The WT root (left) accumulates Fe and callose in the EZ and SCN (red strips and dots, respectively) and its growth is rapidly inhibited. In the lpr1;lpr2 mutant (right), there is no accumulation of Fe and callose and no inhibition of root growth. In the stop1 and almt1 mutants (middle), Fe and callose accumulates only in the SCN and the root growth inhibition is slow.
Figure 4
Figure 4. −Pi induces cell wall stiffening in the root transition zone.
(a) WT (Coler105) seedlings were transferred to −Pi or +Pi medium for the indicated time prior to measuring the stiffness of the cell surface by AFM in the transition zone of the primary root (see Methods). (b) Seedlings of the indicated genotypes were transferred to +Pi or −Pi medium for 30 min prior to measuring the stiffness of the cell surface by AFM in the transition zone of the primary root. (c) WT (Coler105) seedlings were transferred to −Pi or −Pi-Fe medium for 30 min prior to measuring the stiffness of the cell surface by AFM in the transition zone of the primary root (median±interquartile, Mann–Whitney test. ****P<0.0001; **P<0.01; *P<0.05; NS, not significant (P>0.05)). The experiment was performed twice with consistent results and one representative experiment is shown.
Figure 5
Figure 5. Cell wall stiffening and inhibition of root cell elongation under −Pi are peroxidase-dependent.
(ac) Dose–response relationship of the Δ primary root length plotted as a function of concentration of peroxidase inhibitors (mean±s.d.). For each data point, 3-day-old WT (Coler105) seedlings were transferred for 7 days to −Pi plates containing different concentrations of inhibitor. The structure of the inhibitors is shown above the corresponding curves. (a) Salicylhydroxamic acid (SHAM). Blue data points: −Pi; yellow data point, +Pi without inhibitor (n=12–14 seedlings per condition). (b) 3,3′-diaminobenzidine (DAB) (n=8–12 seedlings per condition). (c) Methimazole (n=11–13 seedlings per condition). (d) Picture of the effect of peroxidases inhibitors on WT seedlings. Three-day-old WT seedlings were transferred for 7 days to +Pi or −Pi plates containing the indicated inhibitors. Top: picture of one representative seedling for each treatment (Methi., methimazole). Arrowheads indicate the primary root tips. Scale bar, 1 cm. Bottom: pictures of the root tips corresponding to the seedlings shown above. Note that inhibitors of peroxidases suppress the −Pi-induced early differentiation of root hairs. (e) Three-day-old WT seedlings were transferred for 30 min to +Pi or −Pi medium with or without 15 μM SHAM prior to measuring the stiffness of the cell surface by AFM in the transition zone of the primary root (median±interquartile, Tukey whiskers, Mann–Whitney test: ****P<0.0001). (f) Effect of SHAM and DAB on root epidermal cell length. Three-day-old WT seedlings were transferred for 7 days to +Pi or −Pi medium with or without 15 μM SHAM or 100 μM DAB prior to measuring the root epidermal cell length (median±interquartile; Tukey whiskers, Mann–Whitney test: ****P<0.0001, n=number of cells). (g) Peroxidase activity revealed by 4-chloro-1-naphtol staining of the WT primary root tip (the colourless dye turns black with peroxidases activity). Four-day-old WT seedlings were transferred for 48 h to +Pi or in −Pi plates with or without 15 μM SHAM (see also Supplementary Fig. 9a). (h) Peroxidase activity revealed by 4-chloro-1-naphtol staining of the primary root tip of the indicated genotypes. Four-day-old seedlings were transferred for 48 h to +Pi or in −Pi plates prior to staining. Single and double-headed arrows indicate the position of the elongation zone. The experiments were performed three times with consistent results and one representative experiment is shown (ac,g,h). Scale bars, 100 μm (g,h).
Figure 6
Figure 6. Expressing STOP1 in the endodermis or early cortex of the stop1 mutant is sufficient to restore root growth arrest under −Pi.
(a) Schematic diagram showing the position of cortex, endodermis and quiescent centre, and the tissue-specific expression (blue) conferred by the indicated promoters. Only one longitudinal half of the root is shown. (b) Primary root growth of stop1KO mutant lines with tissue-specific expression of STOP1. Three-day-old seedlings were transferred for 4 days to −Pi and the Δ primary root length measured in 5–6 independent transgenic lines par construct (mean±s.d., n=17 seedlings per line; box and Tukey whiskers; statistics by unpaired two-tailed t-test: ****P<0.0001; NS, not significant). The experiment was performed twice with consistent results; one experiment is shown. (c) Fe accumulation and distribution in primary root tips of pSCR::STOP1 and pCo2::STOP1 lines. Three-day-old seedlings of the indicated genotypes (two independent lines for each construct) were transferred from +Pi to +Pi or −Pi plates for 48 h prior to Perls/DAB staining; one representative seedling is shown. Note the accumulation of Fe in the EZ of the complemented lines (white arrowhead) compared to the parental stop1KO line. Scale bar, 100 μm. (d) The dominant negative Stop148 was expressed in the endodermis (pSCR::Stop148), in the cortex (pCo2::Stop148) or in both cell types (F1 progeny from the cross pSCR::Stop148 X pCo2::Stop148) in Coler105. Seedlings were grown for 5 days under −Pi and the primary root length measured (mean±s.d., n=7–14 seedlings per line; one-way ANOVA; ****P<0.0001; NS, not significant). Note that the primary root of transgenic lines behaves like in WT control.
Figure 7
Figure 7. Working model depicting the effect of −Pi on cell proliferation and elongation in the primary root tip.
A low Pi/Fe ratio, that is, −Pi stress (yellow star), post-transcriptionally activates STOP1 which induces ALMT1 expression followed by malate exudation into the apoplast. The interaction of malate-altered iron chelation and LPR1 ferroxidase activity inhibits cell elongation by peroxidase-dependent cell wall stiffening. The P5-type ATPase PDR2 restricts LPR1 function. The LPR1–PDR2 module interacts with an unknown pathway parallel to STOP1–ALMT1 (question mark) to inhibit cell division in the SCN by a similar mechanism involving accumulation of Fe and callose, peroxidase-activity, and cell wall thickening. Mutations in STOP1 and ALMT1 restore cell elongation under −Pi but cell divisions are still inhibited.

References

    1. Lynch J. P. & Brown K. M. Topsoil foraging—an architectural adaptation of plants to low phosphorus availability. Plant Soil 237, 225–237 (2001).
    1. Lopez-Arredondo D. L., Leyva-Gonzalez M. A., Gonzalez-Morales S. I., Lopez-Bucio J. & Herrera-Estrella L. Phosphate nutrition: improving low-phosphate tolerance in crops. Annu. Rev. Plant Biol. 65, 95–123 (2014). - PubMed
    1. Heidstra R. & Sabatini S. Plant and animal stem cells: similar yet different. Nat. Rev. Mol. Cell. Biol. 15, 301–312 (2014). - PubMed
    1. Petricka J. J., Winter C. M. & Benfey P. N. Control of Arabidopsis root development. Annu. Rev. Plant Biol. 63, 563–590 (2012). - PMC - PubMed
    1. Sanchez-Calderon L. et al.. Characterization of low phosphorus insensitive mutants reveals a crosstalk between low phosphorus-induced determinate root development and the activation of genes involved in the adaptation of Arabidopsis to phosphorus deficiency. Plant Physiol. 140, 879–889 (2006). - PMC - PubMed

Publication types

MeSH terms