. 2017 Aug;35(8):765-772.
doi: 10.1038/nbt.3860. Epub 2017 May 15.

HLA-E-expressing pluripotent stem cells escape allogeneic responses and lysis by NK cells

Affiliations

HLA-E-expressing pluripotent stem cells escape allogeneic responses and lysis by NK cells

Germán G Gornalusse et al. Nat Biotechnol. 2017 Aug.

Abstract

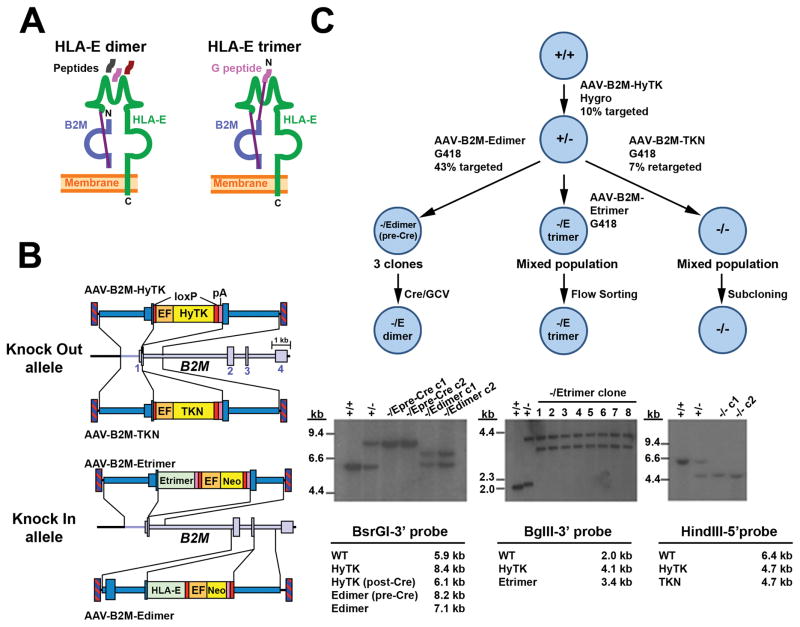
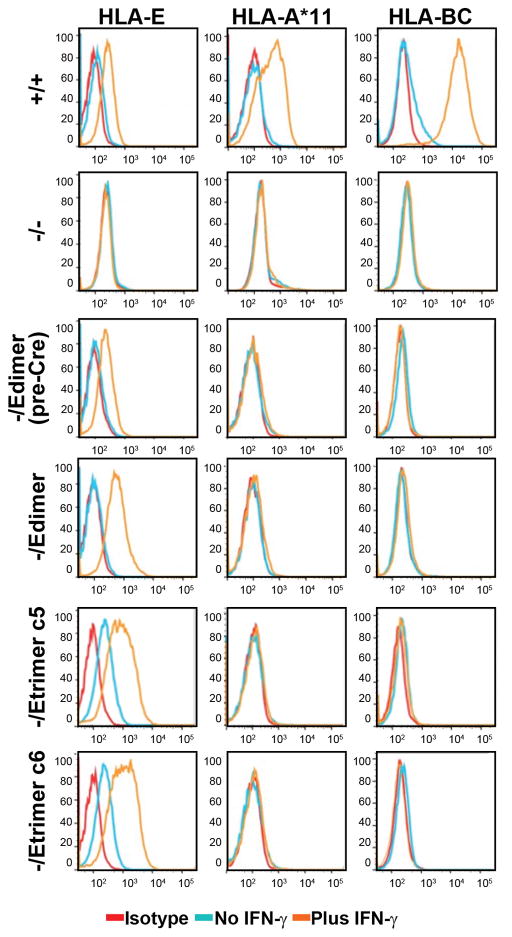
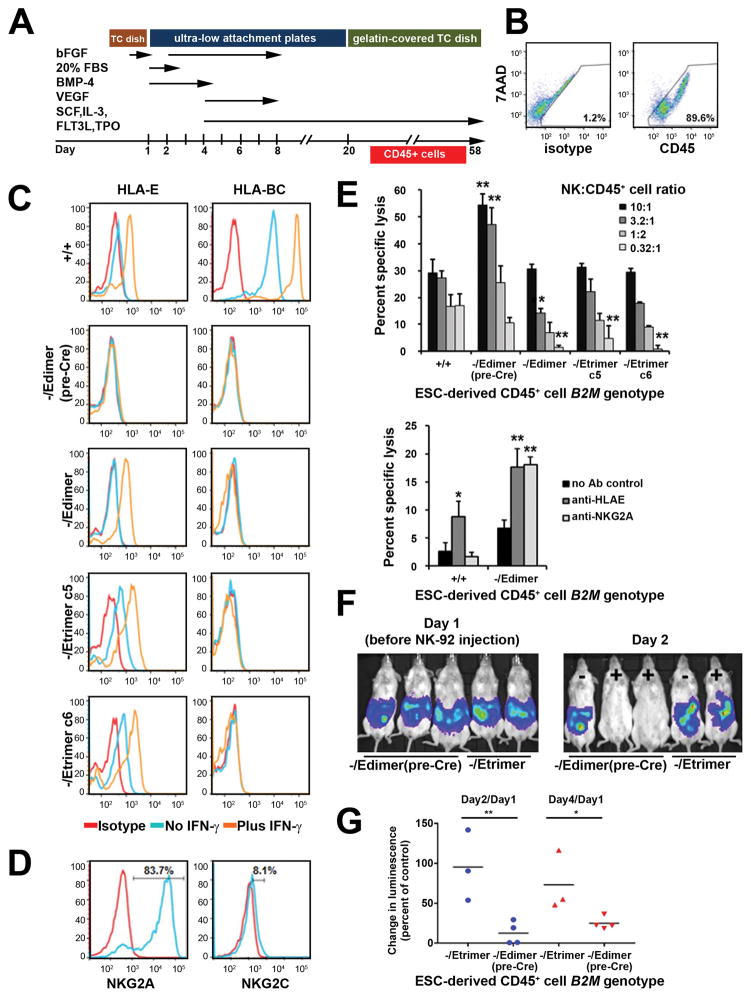
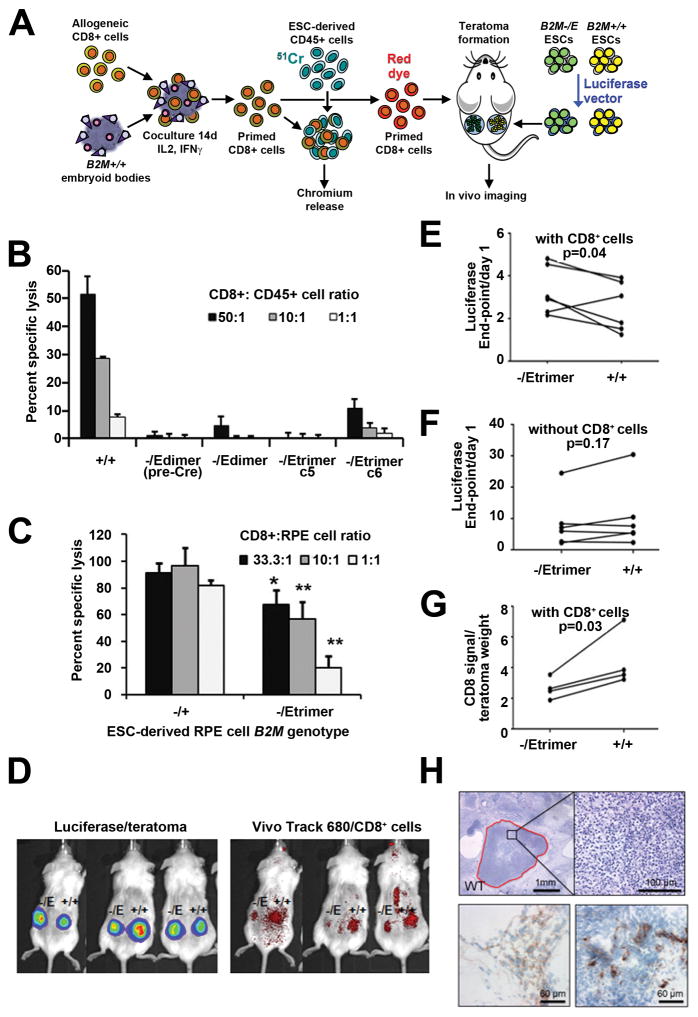
Polymorphisms in the human leukocyte antigen (HLA) class I genes can cause the rejection of pluripotent stem cell (PSC)-derived products in allogeneic recipients. Disruption of the Beta-2 Microglobulin (B2M) gene eliminates surface expression of all class I molecules, but leaves the cells vulnerable to lysis by natural killer (NK) cells. Here we show that this 'missing-self' response can be prevented by forced expression of minimally polymorphic HLA-E molecules. We use adeno-associated virus (AAV)-mediated gene editing to knock in HLA-E genes at the B2M locus in human PSCs in a manner that confers inducible, regulated, surface expression of HLA-E single-chain dimers (fused to B2M) or trimers (fused to B2M and a peptide antigen), without surface expression of HLA-A, B or C. These HLA-engineered PSCs and their differentiated derivatives are not recognized as allogeneic by CD8+ T cells, do not bind anti-HLA antibodies and are resistant to NK-mediated lysis. Our approach provides a potential source of universal donor cells for applications where the differentiated derivatives lack HLA class II expression.


Figures

Figure 1
Figure 1
AAV-mediated knock in of HLA-E. (a) Schematic representation of HLA-E single chain (SC) molecules. The HLA-E heavy chain is covalently linked to B2M (by a (G4S)4 linker. In the trimer, the HLA-G signal peptide is covalently attached to the N- terminus by a (G4S)3 linker. (b) AAV knock out and knock in vectors used to edit B2M. Inverted terminal repeats (hatched boxes), B2M exons (large boxes), homology arms (dark blue), loxP signals (red), synthetic poly(A) signals (pink), HyTK or TKN antibiotic resistance cassettes (yellow), human elongation factor-1 alpha (EF-1α) promoter (orange), and HLA-E heavy chain or trimer reading frames (green) are shown. (c) Stepwise targeting strategy to generate B2M-/Edimer, B2M-/Etrimer and B2M−/− ESC lines. Bottom panels show corresponding Southern blots demonstrating accurate gene editing with B2M genotypes of each sample shown, and digests with predicted fragment sizes below (allele maps in Supplementary Fig. 1A).
Figure 2
Figure 2
Inducible HLA-E expression without other class I molecules. Flow cytometry of HLA-E, HLA-A*11 (present in WT Elf-1 cells) and HLA-BC expression in the presence (orange) or absence (light blue) of IFNγ treatment. Isotype control tracings are shown in red. Single cell suspensions of Elf-1 ESCs with each indicated B2M genotype were derived by trypsin digestion of IFN-γ-treated ESCs. See Supplementary Table 2 for full HLA genotypes.
Figure 3
Figure 3
Protection of HLA-E-expressing cells from NK cell-mediated lysis. (a) Schematic representation of the hematopoietic differentiation protocol used for Elf-1 ESCs. Hematopoietic cells were harvested from day 24 to day 58. (b) Representative CD45 expression on day 38 suspension cells produced by B2M-/Etrimer ESC clone c5 as measured by flow cytometry (y axis, 7AAD; x axis, isotype control or CD45). Results for other B2M-edited lines are shown in Supplementary Figure 4A. (c) Flow cytometry of HLA-E and HLA-BC expression in ESC-derived CD45+ cells with the indicated B2M genotypes. (d) Expression of inhibiting and activating receptors NKG2A and NKG2C on NK cells derived from a healthy donor (donor 1). Isotype and specific antibody tracings shown in red and blue respectively. Percents shown are calculated by subtracting corresponding isotype control frequencies. (e) Chromium release assay results obtained with ESC-derived CD45+ cells of the indicated B2M genotype and normal NK cells (donor 1) at the indicated ratios (mean + SD, n=3). The p values (one-way ANOVA test) were <0.002 at all cell ratios. Asterisks indicate pair-wise comparisons with B2M+/+ cells that had p<0.05(*) or <0.01(**) after applying the post hoc Tukey HSD test. (f) Chromium release assays performed as in (e) in the presence of neutralizing antibodies against either HLA-E or NKG2A at a NK/CD45+ cell ratio of 10:1 (mean + SD, n=3). P values were calculated using the one-way ANOVA followed by Tukey HSD test; asterisks indicate statistical significant differences in regard to no Ab controls. (g) Luciferase imaging of 5 representative mice containing ESC-derived CD45+ cells of B2M-/Edimer(pre- Cre) (serves as class I-negative control) or B2M-/Etrimer genotypes, some of which also received NK-92 cells (− or + labels in the right panel). Results are shown for the same mice before NK-92 injection (Day 1) and one day afterwards (Day 2). (h) Quantitation of luciferase-expressing CD45+ cell levels in mice treated as in (g). The change in luminescence between Day 1 (pre NK-92 cell injection) and Day 2 or Day 4 (1 and 3 days after NK-92 cell injection) was measured for individual mice and divided by the average of control mice that did not receive NK-92 cells (n = 3 for both B2M-/Etrimer and B2M-/Edimer (pre-Cre) control groups). Horizontal black bars indicate the mean for each group. P values were calculated using the unpaired Student’s t test. For all panels, ** = p<0.01, and * = p<0.05.
Figure 4
Figure 4
Allogeneic CD8+ T cells do not recognize HLA-engineered cells. (a) Schema for priming allogeneic CD8+ T cells against Elf-1 HLA antigens. (b) Chromium release assays measuring the cytotoxicity of allogeneic CD8+ T cells towards ESC-derived hematopoietic cells with the indicated B2M genotypes (mean + SD, n=3; p values determined by one-way ANOVA were <0.001 and by HSD Tukey test p<0.01, when comparing all the HLA-engineered lines to B2M+/+ cells at all cell ratios). For representation purposes, negative specific lysis values were plotted as zero. (c) Analogous chromium release assays towards ESC-derived RPE cells with the indicated B2M genotypes (mean + SD, n=3 for each cell ratio, p values determined by unpaired Student’s t-test, * = p<0.05 and ** = p<0.01). (d) Representative examples of teratoma and CD8+ cell imaging in live animals. (e) Fold change of luciferase expression by B2M-/Etrimer and B2M+/+ teratomas from day 1 of CD8+ cell infusion to endpoint (day 12, n=4 or day 16, n=2), with each line representing one mouse. P-value was determined by paired Student t- test (n=6 mice). (f) Same as (e) but luciferase measurements of teratomas were made in control mice that did not receive CD8+ T cells (n=6 mice per group). (g) Infiltration of teratomas with allogeneic CD8+ T cells as measured by fluorescent signal divided by weight of teratomas harvested at the time of sacrifice (n=4 mice, P-value determined by paired Student t- test). (h) Representative hematoxylin and eosin staining of a B2M+/+ teratoma harvested from mice that received allogeneic CD8+ T cells. Necrotic areas with abundant polymorphonuclear cells are indicated in red. The two bottom photos show immunohistochemistry staining of CD8+ T cells infiltrating B2M+/+ teratomas.

Comment in

References

    1. Taylor CJ, Peacock S, Chaudhry AN, Bradley JA, Bolton EM. Generating an iPSC bank for HLA-matched tissue transplantation based on known donor and recipient hla types. Cell Stem Cell. 2012;11:147–152. - PubMed
    1. Nishikawa S, Goldstein Ra, Nierras CR. The promise of human induced pluripotent stem cells for research and therapy. Nat Rev Mol Cell Biol. 2008;9:725–729. - PubMed
    1. Taylor CJ, et al. Banking on human embryonic stem cells: Estimating the number of donor cell lines needed for HLA matching. Lancet. 2005;366:2019–2025. - PubMed
    1. Braciale TJ. Antigen processing for presentation by MHC class I molecules. Curr Opin Immunol. 1992;4:59–62. - PubMed
    1. Arce-Gomez B, Jones EA, Barnstable CJ, Solomon E, Bodmer WF. The genetic control of HLA-A and B antigens in somatic cell hybrids: requirement for beta2 microglobulin. Tissue Antigens. 1978;11:96–112. - PubMed