. 2017 May 15:2:17072.
doi: 10.1038/nmicrobiol.2017.72.

Nitric oxide prevents a pathogen-permissive granulocytic inflammation during tuberculosis

Affiliations

Nitric oxide prevents a pathogen-permissive granulocytic inflammation during tuberculosis

Bibhuti B Mishra et al. Nat Microbiol. .

Abstract

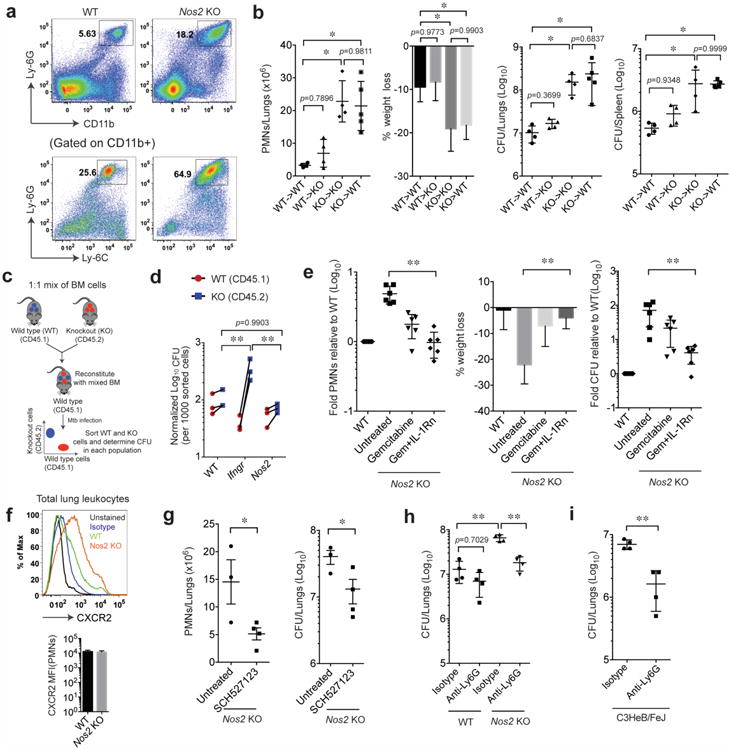
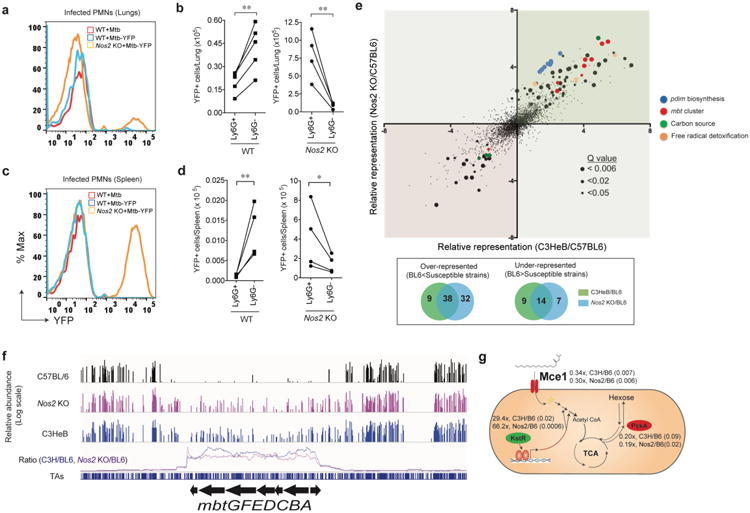
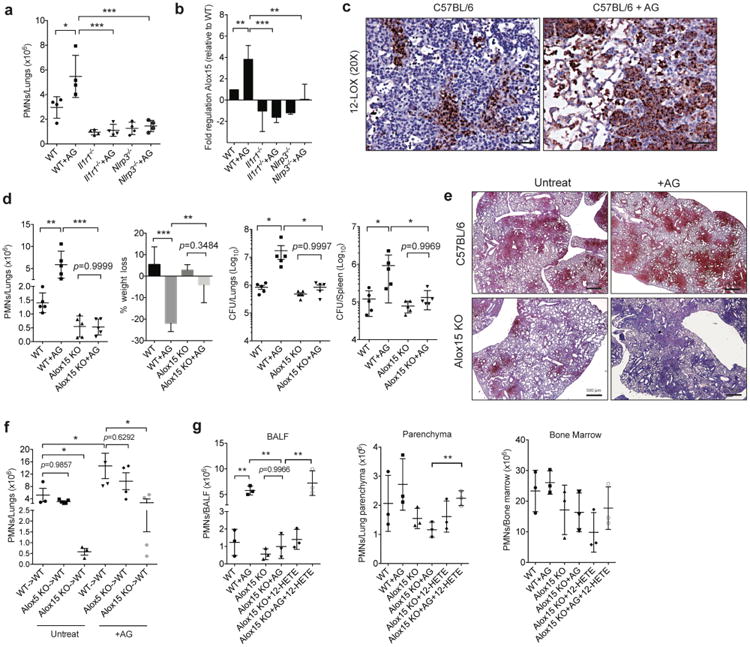
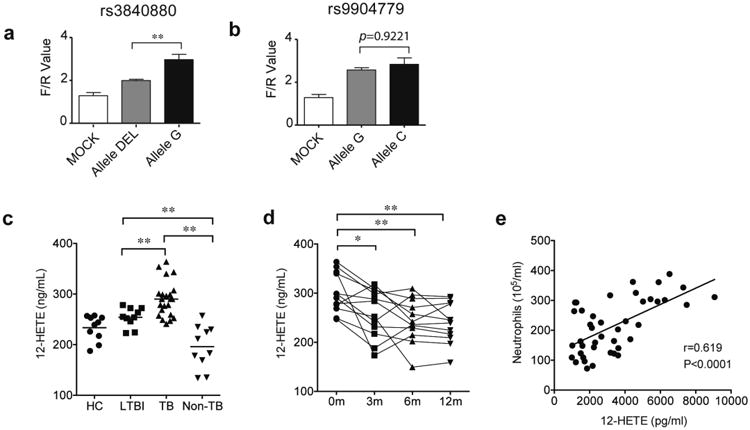
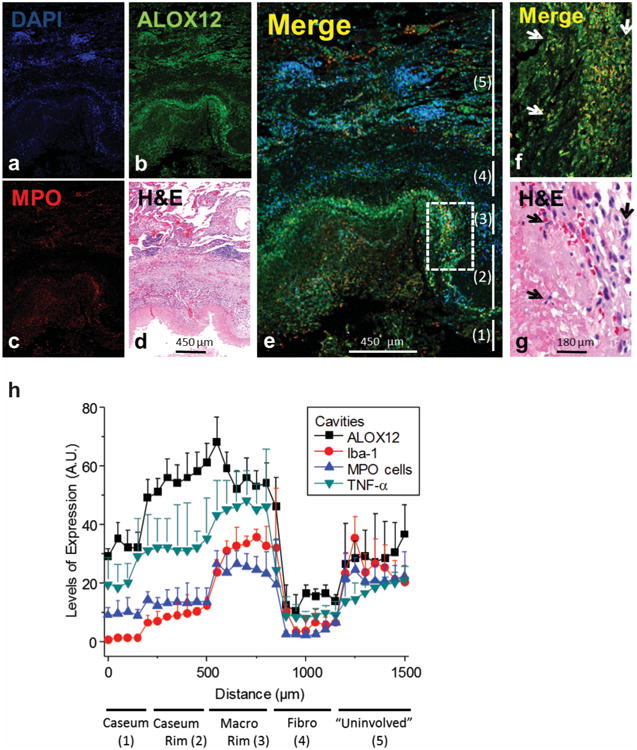
Nitric oxide contributes to protection from tuberculosis. It is generally assumed that this protection is due to direct inhibition of Mycobacterium tuberculosis growth, which prevents subsequent pathological inflammation. In contrast, we report that nitric oxide primarily protects mice by repressing an interleukin-1- and 12/15-lipoxygenase-dependent neutrophil recruitment cascade that promotes bacterial replication. Using M. tuberculosis mutants as indicators of the pathogen's environment, we inferred that granulocytic inflammation generates a nutrient-replete niche that supports M. tuberculosis growth. Parallel clinical studies indicate that a similar inflammatory pathway promotes tuberculosis in patients. The human 12/15-lipoxygenase orthologue, ALOX12, is expressed in cavitary tuberculosis lesions; the abundance of its products correlates with the number of airway neutrophils and bacterial burden and a genetic polymorphism that increases ALOX12 expression is associated with tuberculosis risk. These data suggest that M. tuberculosis exploits neutrophilic inflammation to preferentially replicate at sites of tissue damage that promote contagion.


Figures

Figure 1
Figure 1. Anti-inflammatory activity of Nos2 protects mice from TB disease
a. CD11b+ and Ly6-Ghi (inset in top panel), Ly-6C+ and Ly-6G+ (inset in bottom panel) neutrophils accumulate in the lungs of Mtb-infected Nos2-/- mice (gated on singlet/live cells). b. Bone marrow chimeric mice were infected with Mtb (notation indicates bone marrow donor genotype -> recipient genotype), and lung neutrophils, % weight loss, and total bacterial burden in the lungs and spleen (expressed in colony forming units, CFU) were assessed 4wks after infection. Values presented as Mean ± SD. **, p<0.01, one-way ANOVA with Tukey's multiple comparison test. c. Schematic for generation of mixed bone marrow chimeric mice. d. CFU were determined in the purified hematopoietic cells of indicated genotypes. **, p<0.01, Two-way ANOVA with Bonferroni multiple comparison test. e. Mtb infected Nos2-/- mice were treated with gemcitabine, either alone or in combination with IL-1Rn. After four weeks of infection, the indicated metrics of disease were quantified. Values shown (Mean ± SD) are pooled from two independent experiments. **, p<0.01, one-way ANOVA with Tukey's multiple comparison test. f. CXCR2 surface expression was determined in CD45+ lung leukocytes (top panel) and mean fluorescence intensity (MFI) of CXCR2 in CD45+ CD11b+ Ly-6G+ F4-80- neutrophils (bottom panel) obtained at 4wks post infection. g. CXCR1/2 signaling was blocked in infected Nos2-/- mice with SCH-527123, and the number of neutrophils and CFU in the lung were determined after 4wks of infection. Values presented as Mean ± SD. **, p<0.05, Two-tailed unpaired t-test with Welch correction. h. Bacterial load in the lungs of anti-Ly-6G- or isotype-treated animals were determined by CFU assay after 14 days of neutrophil depletion. All mice were infected via the aerosol route. **, p<0.001, one-way ANOVA with Tukey's multiple comparison test. i. Bacterial burden in the lungs of C3HeB/FeJ mice was determined in the lungs of anti-Ly-6G- or isotype-treated animals after 14 days of neutrophil depletion. **, p<0.001, Two-tailed unpaired t-test with Welch correction. All the data shown are representative of at least two independent experiments except in “g” and “i” (done only once).
Figure 2
Figure 2. Neutrophilic inflammation produces a growth permissive environment for Mtb
a. Representative histogram of Mtb-YFP fluorescence in CD11b+Ly-6Ghigh lung leukocytes of wild type C57BL/6 (WT) or Nos2-/- mice infected with either Mtb or Mtb-YFP via aerosol. b. Enumeration of infected (YFP+) neutrophils (CD11b+Ly-6G+) or monocytes/macrophages (CD11b+Ly-6G-) in WT and Nos2-/- mouse lungs after aerosol infection. c. Representative histogram of Mtb-YFP fluorescence in CD11b+Ly-6Ghigh cells and d. Enumeration of infected (YFP+) neutrophils (CD11b+Ly-6G+) or monocytes/macrophages (CD11b+Ly-6G-) in WT and Nos2-/- mice spleen after intravenous infection. (b and d). **, p<0.05, two-tailed unpaired t-test with Welch correction. Data presented are representative of two independent experiments. e. Genome-wide mutant fitness analysis in mouse models of different inflammatory potential. Mice were infected with Mtb transposon mutant library by intravenous injection. After four weeks of selection in mice, the relative abundance of individual Mtb mutants in which a single non-essential gene is disrupted (n=3127) was determined using TNseq. Each point represents the relative abundance of mutants lacking an individual gene in Nos2-/- (y-axis) or C3HeB mice (x-axis), each compared to C57BL/6. Point size indicates statistical significance (log of Q value) between C57BL/6 and Nos2-/- mice. Genes of known function are colored as described in the panel. Venn diagram showing the differential representation of the number of mutants in susceptible strains (Nos2-/- and C3HeB) relative to C57BL6. f. Representative TNseq data for the mycobactin gene cluster. Raw data (upper three tracks) displays the abundance of each insertion mutant (height of each bar on log scale) in mutant pools selected in the three indicated mouse strains. ‘Relative Abundance’ represents the number of Illumina reads corresponding to the insertion site as described in Methods. Lower track represents the ratio of relative mutant abundance over a window of 20 insertion sites between each mutant mouse and C57BL/6 control (indicated by color). g. Summary of differential selection on carbon metabolic mutants. The function of each gene or gene cluster is depicted along with the degree of differential abundance and Q value relative to the C57BL/6 control strain (Q val in parentheses). In panels f and g, the color of each protein represents the sign of its differential representation; red and green indicate decreased or increased representation in mutant mice, respectively.
Figure 3
Figure 3. IL-1 dependent 12/15-LOX products contribute to TB susceptibility in Nos2-/- mice
a. Neutrophil infiltration into the lungs was quantified in each mouse strain 4 weeks after intratracheal infection with ∼1×10⁵ Mtb strain 18b. Aminoguanidine treated groups are indicated (“AG”). b. Relative abundance of Alox15 mRNA in the lungs of animals from panel “a” was quantified by qRT-PCR. Data shown (Mean ± SD) are representative of two independent experiments, *, p<0.05; **, p<0.001, ***, p<0.0001, one-way ANOVA with Tukey's multiple comparison test. c. WT and Alox15-/- mice were infected with ∼200 CFU of Mtb H37Rv via the aerosol route. 4 wks after infection, 12/15-LOX expression in the lungs was quantified by immunohistochemical staining of lung sections of untreated- and AG-treated WT mice (Scale bars represent 500um). d. Lung neutrophils, % weight loss, and total bacterial burden in the lung and spleen were quantified in untreated and AG treated groups of WTs and Alox15-/- after 4 wks of Mtb infection. Data shown (Mean ± SD) are representative of six independent experiments. *, p<0.05; **, p<0.001, ***, p<0.0001, one-way ANOVA with Tukey's multiple comparison test. e. Immunohistochemical staining for anti-Ly6G in lung sections of Mtb infected WT and Alox15-/- mice treated with/without AG (Scale bars represent 500um). f. Lung neutrophils in cohorts of the indicated bone marrow chimeric mice were determined five weeks after infection. Notation indicates bone marrow donor genotype -> recipient genotype. Aminoguanidine treated groups are indicated (“AG”). g. Neutrophil numbers in bronchoalveolar lavage fluid (BALF), lung parenchyma after lavage, and bone marrow were determined in Mtb infected WT and Alox15-/- mice, which were treated with 12-HETE and/or AG. (f-g), Data shown (Mean ± SD) are from one experiment. *, p<0.05; **, p<0.001, one-way ANOVA with Tukey's multiple comparison test. All mice were infected via the aerosol route, except as indicated in panel “a”.
Figure 4
Figure 4. Increased expression and activity of 12-LOX are associated with active tuberculosis in humans
a-b. ALOX12-promoter luciferase reporter plasmids carrying different alleles at rs3840880 or rs9904779 were transfected into HeLa cells. After 48h, the indicated luciferase activities were quantified. “F/R value” indicates the ratio of Firefly/Renilla luciferase. Values shown as Mean ± SD. **, p<0.001, one-way ANOVA with Tukey's multiple comparison test. c. The concentrations of 12-HETE in the plasma from healthy controls, ‘HC’ (n = 10), latent TB infection, ‘LTBI’ (n = 10), pulmonary tuberculosis, ‘TB’ (n = 20), and subjects suffering from non-TB lung disease, ‘non-TB’ (n = 10) were determined by ELISA. d. 12-HETE levels in the plasma of active TB patients were determined by ELISA at the indicated time points after initiation of anti-TB chemotherapy. e. 12-HETE levels were significantly correlated with the neutrophil counts in the BALF of patients with pulmonary TB, at the time of diagnosis (n=42). The difference among groups were compared by using one-way ANOVA followed by Tukey's multiple comparison test *, p<0.05, **, p<0.001. Pearson's correlation coefficient (r) and P value of correlation (P) are indicated.
Figure 5
Figure 5. ALOX12 in expressed in inflammatory areas of cavitary TB lesions
(a-e) Representative single channel images of a lung cavity, including the caseous center at the bottom and adjacent cellular/fibrotic layers, stained for DAPI (a), ALOX12 (b) MPO (c) and a merged image of all three (e). d. Hematoxylin-eosin (H&E) staining of the region shown in (a-e). f. Magnification of the inset outlined in (e) showing the co-localization of MPO positive cells and ALOX12 at the interface between the caseous region and cellular rim. The numbers to the right refer to the 5 regions of the cavitary lesion delineated in panel (h), from the caseum and outward into the uninvolved lung tissue. (g) H&E staining of the region shown in (f). Arrows in (f-g) denote MPO- and ALOX12-positive neutrophils with characteristic multi-lobular nuclei. h. Quantification of ALOX12, TNF-α, Iba-1 and MPO positive pixels in regions extending from the caseous center to the outer rim and into the cellular and fibrotic layers, performed in 4 different cavitary tissues and averaged. Arbitrary units (A.U.) on y-axis indicates the average number of positive pixels in the indicated region. X-axis indicates the ‘distance’ from a fixed point in the caseum. The analysis is described in detail in the Methods section.

Comment in

Similar articles

Cited by

References

    1. Canetti G. The Tubercle Bacillus in the Pulmonary Lesion of Man. The American Journal of the Medical Sciences. 1956;231:480.
    1. Mishra BB, et al. Nitric oxide controls the immunopathology of tuberculosis by inhibiting NLRP3 inflammasome-dependent processing of IL-1β. Nat Immunol. 2013;14:52–60. - PMC - PubMed
    1. Niazi MKK, et al. Lung necrosis and neutrophils reflect common pathways of susceptibility to Mycobacterium tuberculosis in genetically diverse, immune-competent mice. Dis Model Mech. 2015;8:1141–1153. - PMC - PubMed
    1. Mattila JT, Maiello P, Sun T, Via LE, Flynn JL. Granzyme B-expressing neutrophils correlate with bacterial load in granulomas from Mycobacterium tuberculosis-infected cynomolgus macaques. Cell Microbiol. 2015;17:1085–1097. - PMC - PubMed
    1. Berry MPR, et al. An interferon-inducible neutrophil-driven blood transcriptional signature in human tuberculosis. Nature. 2010;466:973–977. - PMC - PubMed