. 2017 May 15;6(5):e336.
doi: 10.1038/oncsis.2017.33.

Cyclin-dependent kinase 7 is a therapeutic target in high-grade glioma

Affiliations

Cyclin-dependent kinase 7 is a therapeutic target in high-grade glioma

S A Greenall et al. Oncogenesis. .

Abstract

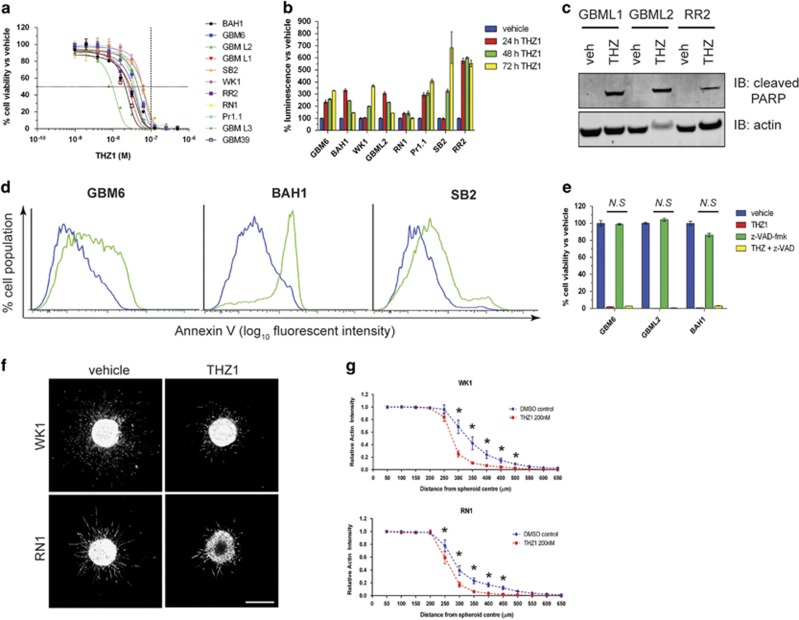
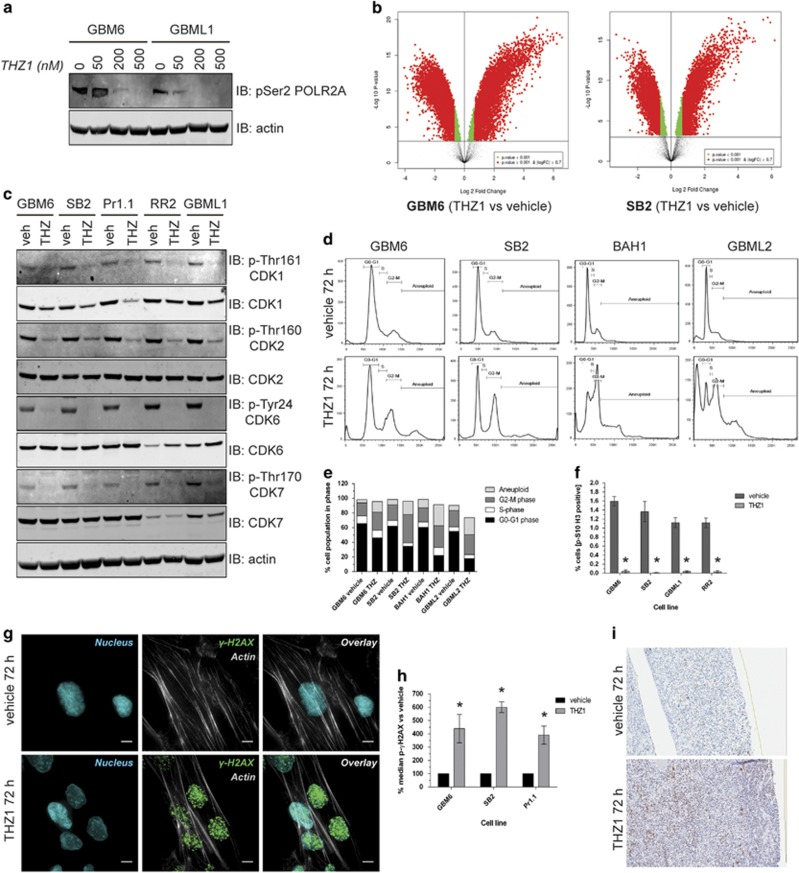
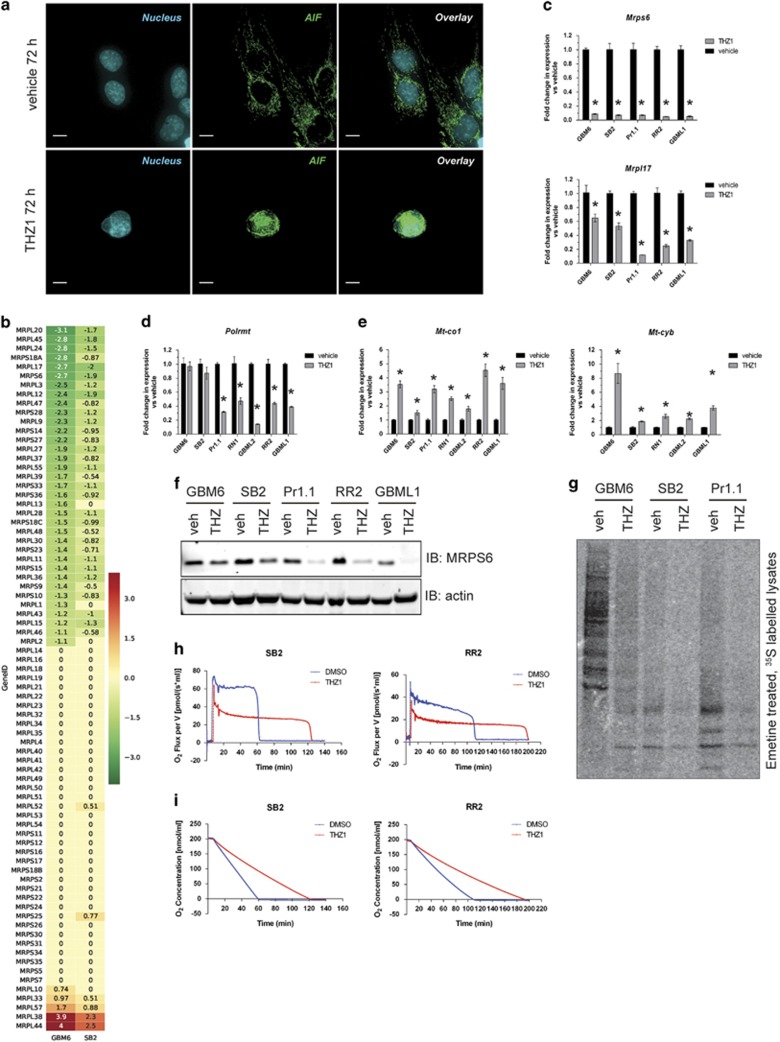
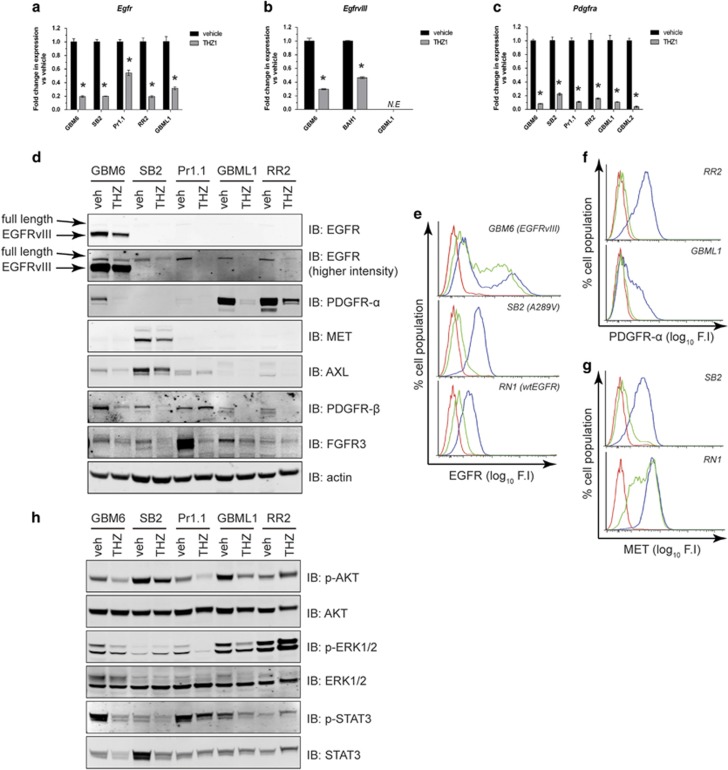
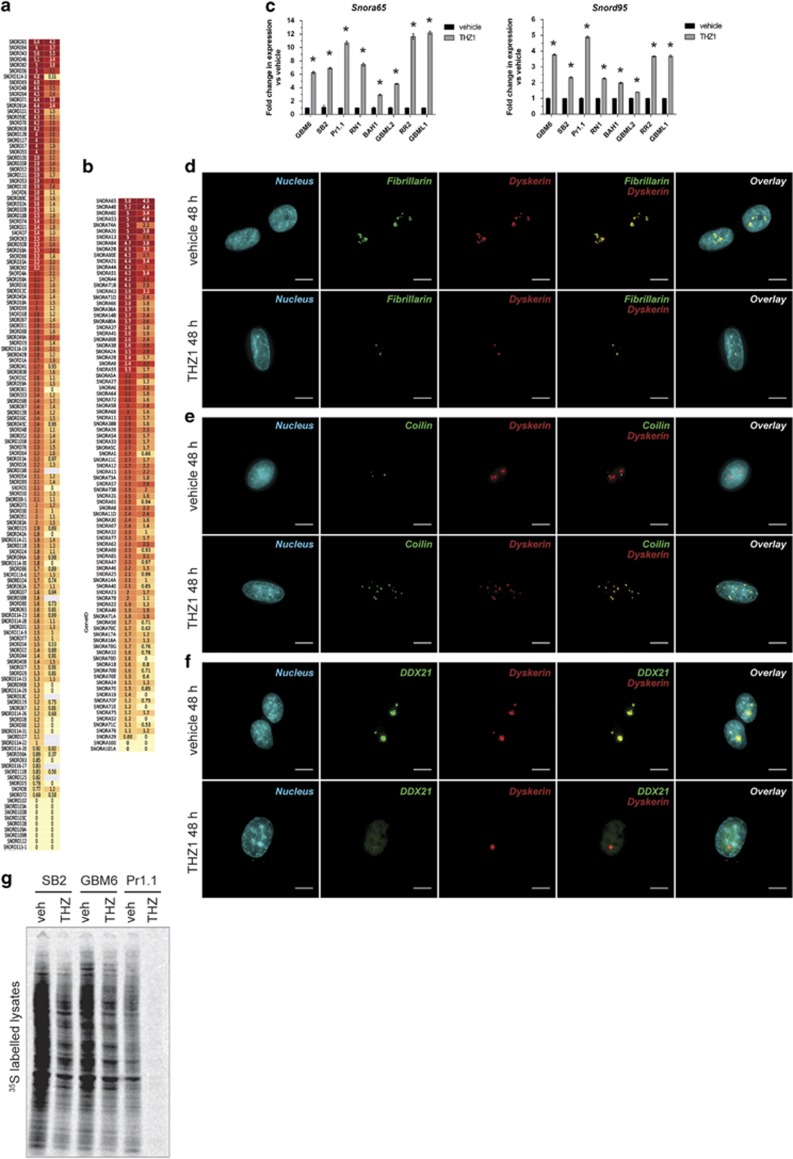
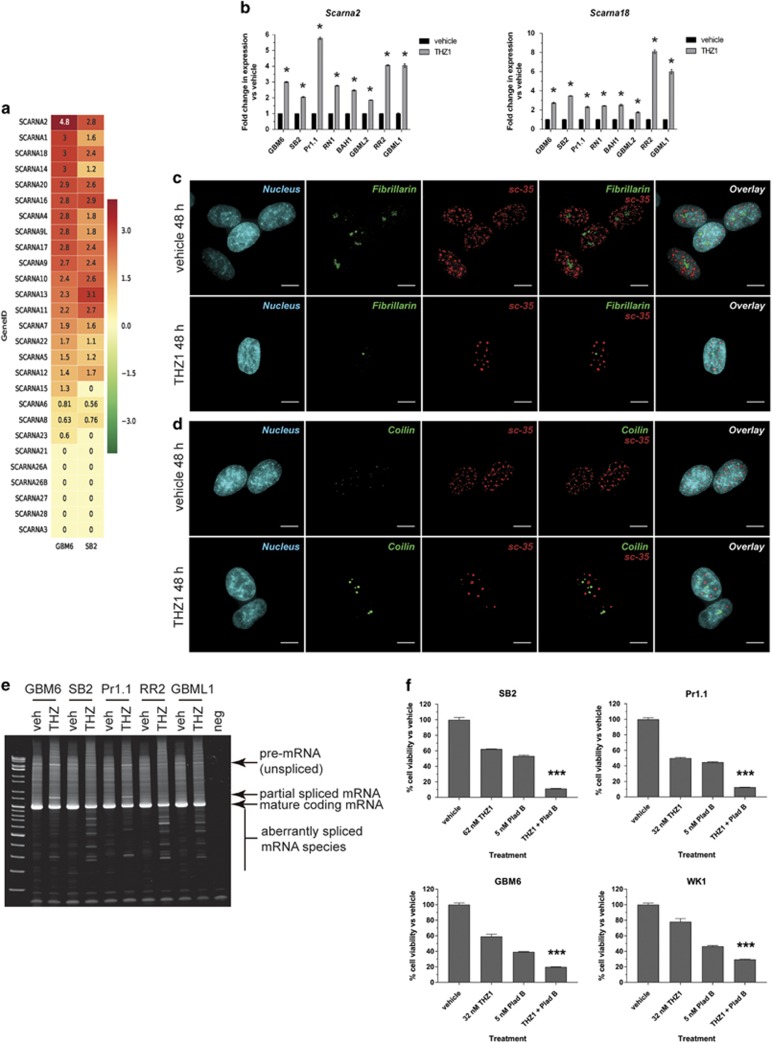
High-grade glioma (HGG) is an incurable brain cancer. The transcriptomes of cells within HGG tumors are highly heterogeneous. This renders the tumors unresponsive or able to adapt to therapeutics targeted at single pathways, thereby causing treatment failure. To overcome this, we focused on cyclin-dependent kinase 7 (CDK7), a ubiquitously expressed molecule involved in two major drivers of HGG pathogenesis: cell cycle progression and RNA polymerase-II-based transcription. We tested the activity of THZ1, an irreversible CDK7 inhibitor, on patient-derived primary HGG cell lines and ex vivo HGG patient tissue slices, using proliferation assays, microarray analysis, high-resolution respirometry, cell cycle analysis and in vivo tumor orthografts. The cellular processes affected by CDK7 inhibition were analyzed by reverse transcriptase-quantitative PCR, western blot, flow cytometry and immunofluorescence. THZ1 perturbed the transcriptome and disabled CDK activation, leading to cell cycle arrest at G2 and DNA damage. THZ1 halted transcription of the nuclear-encoded mitochondrial ribosomal genes, reducing mitochondrial translation and oxidative respiration. It also inhibited the expression of receptor tyrosine kinases such as epidermal growth factor receptor (EGFR) and platelet-derived growth factor receptor-α (PDGFR-α), reducing signaling flux through the AKT, extracellular-signal-regulated kinase 1/2 (ERK1/2) and signal transducer and activator of transcription 3 (STAT3) downstream pathways. Finally, THZ1 disrupted nucleolar, Cajal body and nuclear speckle formation, resulting in reduced cytosolic translation and malfunction of the spliceosome and thus leading to aberrant mRNA processing. These findings indicate that CDK7 is crucial for gliomagenesis, validate CDK7 as a therapeutic target and provide new insight into the cellular processes that are affected by THZ1 and induce antitumor activity.


Conflict of interest statement

The authors declare no conflict of interest.

Figures

Figure 1
Figure 1
THZ1 potently inhibits gliomagenesis and prevents HGG invasion. (a) Eleven HGG primary cell lines, isolated from patient tissue, were treated with increasing doses of THZ1. After 7 days, cells were subjected to cell viability luminescence assays. Graph represents sigmoidal dose-response curves for all cell lines tested and their response to each THZ1 dose. Data are presented as the percentage of viable cells vs vehicle control at each dose±s.e.m. Horizontal dashed line=50% inhibition of cell viability. Vertical dashed line=100 nM THZ1 concentration. (b) Cleaved caspase 3/7 detection in primary cells treated with 200 nM THZ1 for 24, 48 and 72 h. Data represent the percentage luminescence signal obtained for each time point vs vehicle controls±s.e.m. (c) Lysates from primary cells treated for 72 h with 200 nM THZ1 analyzed for the presence of cleaved PARP (top panel) by western blotting. Actin (bottom panel) was used as a loading control. (d) Flow cytometry histograms for Annexin V cell-surface detection on multiple primary cell lines treated with vehicle (blue) or 200 nM THZ1 (green) for 72 h. (e) Cell viability assay plots for primary cell lines treated with vehicle, 200 nM THZ1, 25 μM of the pan-caspase inhibitor z-VAD-fmk or a combination of both for 7 days. Data are presented as the percentage of viable cells vs vehicle control±s.e.m. THZ1 alone vs THZ1+z-VAD-fmk, not significant (N.S) by two-way analysis of variance (ANOVA), d.f.=34. (f) Representative maximum projection confocal images of WK1 spheroids (top panels) and RN1 spheroids (bottom panels) embedded in collagen and stained for actin, after 48 h. Treatments with vehicle (left panels) or 200 nM THZ1 (right panels) are indicated. Scale bar: 500 μm (g) Quantification of spheroid invasion, measured by relative actin intensity over the distance from the spheroid center±s.e.m. Vehicle (dimethyl sulfoxide, DMSO) vs THZ1 for both WK1 and RN1: *P<0.0001 by two-way ANOVA. Data are the average from three independent experiments, with 8–14 individual spheroids analyzed per treatment. All experiments were repeated a minimum of two times over multiple primary cell lines.
Figure 2
Figure 2
THZ1 perturbs the transcriptome and cell cycle, causing mitotic arrest at G2 phase and DNA damage. (a) Lysates from cells treated with increasing doses of THZ1 for 48 h analyzed for pSer2 POL2RA (top panel) by western blotting, with actin used as a loading control (bottom panel). (b) Volcano plots of microarray data documenting the differential expression of genes in THZ1-treated cells vs vehicle-treated cells in GBM6 (top graph) and SB2 (bottom graph). Data are presented as a log2 fold change in gene expression against the log10 P-value statistical probability of this change. Changes of log2 >0.7 with a P-value<0.001 are depicted in red, whereas changes of log2 <0.7 with a P-value<0.001 are depicted in green. Genes displaying no significant differential expression are depicted in black. (c) Lysates from cells treated with vehicle or 200 nM THZ1 for 48 h analyzed for the activation status of multiple CDKs as indicated to the right of panels by western blotting. (d) Histograms of four neurosphere lines permeabilized and stained with propidium iodide after 72-h treatment with vehicle or 200 nM THZ1. The cell cycle phases G0–G1, S, G2–M and aneuploidy are marked. (e) Graphical representation of the percentage of cells in each cell cycle phase after 72 h of vehicle or 200 nM THZ1 treatment across four primary cell lines. Data are presented as the percentage of the total cell population in each cell cycle phase. (f) Quantification of pSer10-Histone 3 staining by flow cytometry for primary cells treated with vehicle or 200 nM THZ1 for 24 h. Data are represented as the percentage of the total cell population staining positive for pSer10-Histone 3±s.e.m. Vehicle vs THZ1 *P<0.05 by two-way analysis of variance (ANOVA), d.f.=14. (g) Representative immunofluorescent z-stack images of SB2 cells treated with vehicle or 200 nM THZ1 for 72 h and stained for actin (gray), pSer139 γH2AX (green) or nucleus (blue). Scale bar: 10 μm. (h) Quantification of pSer139 γH2AX staining in primary cell lines treated with vehicle or 200 nM THZ1 for 72 h. Data are presented as the median pSer132 γH2AX signal for the cell population vs vehicle controls±s.e.m. Vehicle vs THZ1 *P<0.05 by multiple t-test analysis with Holm–Sidak correction, d.f.=4. (i) Ex vivo patient HGG tissue slices treated with vehicle or 200 nM THZ1 for 72 h before immunohistochemical staining for pSer139 γH2AX (brown) and counterstaining for nuclei (blue). All experiments were repeated a minimum of two times over multiple primary cell lines.
Figure 3
Figure 3
THZ1 damages mitochondria by downregulating nuclear-encoded mitochondrial ribosomal proteins, compromising mitochondrial translation and oxidative respiration. (a) Representative immunofluorescent z-stack images of GBM6 cells treated with vehicle or 200 nM THZ1 for 72 h and stained for apoptosis-inducing factor (AIF, green) and nucleus (blue). Scale bar: 10 μm. (b) Heat maps documenting the mean log2 expression changes of the mitochondrial ribosome subunit gene family in THZ1-treated cells vs vehicle controls in GBM6 (left column) and SB2 (right column) as measured by microarray. Green: decrease; red: increase; yellow: no change. (ce) RT–qPCR for nuclear-encoded mitochondrial ribosomal genes Mrps6 (c, top graph), Mrpl17 (c, bottom graph), mitochondrial RNA polymerase Polrmt (d) and the mitochondrial-encoded genes Mt-co1 (e, left graph) and Mt-cyb (e, right graph). All data are graphed as the relative expression of each gene compared with vehicle controls following correction to a multiplexed endogenous Actb control±s.e.m. For all graphs, vehicle vs THZ1 *P<0.05 by multiple t-test analysis with Holm–Sidak correction, d.f.=4. (f) Lysates from primary cells treated with vehicle or 200 nM THZ1 for 48 h were analyzed by western blotting for MRPS6 expression (top panel) with actin used as a loading control (bottom panel). (g) Autoradiographs for lysates isolated from primary cells treated with vehicle or 200 nM THZ1 for 24 h before emetine treatment followed by pulse-chase labeling for 2 h with 35S-labeled methionine and cysteine. (h, i) Representative plots of high-resolution respirometry conducted on live primary cells treated with vehicle or 200 nM THZ1 for 24 h. Graphs show the oxygen flux per volume over time (h) or the concentration of oxygen in the isolated chambers over time (i). All experiments were repeated a minimum of two times over multiple primary cell lines.
Figure 4
Figure 4
RTK expression is significantly decreased by THZ1, reducing multiple downstream oncogenic signaling fluxes. (ac) RT–qPCR of complementary DNA isolated from primary cells treated with vehicle or 200 nM THZ1 was tested for the presence of full-length Egfr (GBM6, RR2 and GBML1), A289V Egfr (SB2) and H773_V774insPH Egfr (a), EgfrvIII only (b) or Pdgfra (c). All data are graphed as the relative expression of each gene compared with vehicle controls following correction to a multiplexed endogenous Actb control±s.e.m. For (b), the EGFRvIII-negative primary cell line GBML1 acted as a negative control. N.E., not expressed. For all graphs in ac, vehicle vs THZ1 *P<0.05 by multiple t-test analysis with Holm–Sidak correction, d.f.=4. (d) Western blot analyses of lysates from primary cells treated with vehicle or 200 nM THZ1 for 48 h for RTK protein expression. Full-length EGFR and EGFRvIII-specific bands are depicted by the arrows. Actin was used as a loading control. (eg) Flow cytometry histograms for cell-surface expression of EGFR (EGFRvIII, wtEGFR and A289V EGFR (e), PDGFR-α (f) and MET (g) in multiple primary cell lines). Data are presented as percentage cell population over log10 fluorescence intensity of signal (F.I). Red: isotype antibody. Blue: primary antibody on vehicle-treated cells. Green: primary antibody on cells treated with 200 nM THZ1 for 48 h. (h) Lysates from (d) were analyzed for AKT, ERK1/2 and STAT3 activation by western blotting. Total AKT was used as a loading control. All experiments were repeated a minimum of two times over multiple primary cell lines.
Figure 5
Figure 5
THZ1 damages the nucleolar and Cajal body structures, leading to loss of cytoplasmic translation. (a, b) Heat maps documenting the mean log2 expression changes of the snoRNA C/D (a) and snoRNA H/ACA (b) class of non-coding RNAs in THZ1-treated cells vs vehicle controls in GBM6 (left column) and SB2 (right column) as measured by microarray. Green: decrease; red: increase; yellow: no change. (c) RT–qPCR validation of upregulation of snoRNA for multiple primary cell lines treated with vehicle or 200 nM THZ1 for 24 h for Snora65 (left graph) and Snord95 (right graph). All data are graphed as the relative expression of each snoRNA compared with vehicle controls following correction to a multiplexed endogenous Actb control±s.e.m. For both graphs, vehicle vs THZ1 *P<0.05 by multiple t-test analysis with Holm–Sidak correction, d.f.=4. (df) Immunofluorescence z-stack images for GBM6 cells treated with vehicle or 200 nM THZ1 for 48 h. Images depict the nucleus in blue, dyskerin in red, fibrillarin (d), coilin (e) or DDX21 (f) in green, and any colocalization of signal in yellow. Scale bar: 10 μm. (g) Autoradiographs for lysates isolated from primary cells treated with vehicle or 200 nM THZ1 for 24 h before pulse-chase labeling for 2 h with 35S-labeled methionine and cysteine. All experiments were repeated a minimum of two times over multiple primary cell lines.
Figure 6
Figure 6
Spliceosomal function is disrupted by THZ1 through nuclear speckle damage, resulting in aberrant mRNA splicing. (a) Heat maps documenting the mean log2 expression changes of the scaRNA class of non-coding RNAs in THZ1-treated cells vs vehicle controls in GBM6 (left column) and SB2 (right column) as measured by microarray. Green: decrease; red: increase; yellow: no change. (b) RT–qPCR validation of upregulation of scaRNA for multiple primary cell lines treated with vehicle or 200 nM THZ1 for 24 h for Scarna2 (left graph) and Scarna18 (right graph). All data are graphed as the relative expression of each snoRNA compared with vehicle controls following correction to a multiplexed endogenous Actb control±s.e.m. For both graphs, vehicle vs THZ1 *P<0.05 by multiple t-test analysis with Holm–Sidak correction, d.f.=4. (c, d) Immunofluorescence z-stack images for GBM6 cells treated with vehicle or 200 nM THZ1 for 48 h. Images depict the nucleus in blue, sc-35 in red, fibrillarin (c) or coilin (d) in green and any colocalization of signal in yellow. Scale bar: 10 μm. (e) RT–PCR of full-length EIF4A1 mRNA spanning exon 1 to exon 10 for RNA isolated from multiple primary cell lines treated with vehicle or 200 nM THZ1 for 24 h. Products representing full-length unspliced mRNA, partially spliced mRNA, fully spliced mature mRNA and aberrantly spliced mRNA are indicated. (f) HGG cell lines were treated with a combination of low-dose spliceosomal inhibitor, pladienolide B and THZ1. After 7 days, cells were subjected to cell viability luminescence assays. Data are presented as the percentage of viable cells vs vehicle control for each treatment±s.e.m. ***P<0.0001 by one-way analysis of variance (ANOVA) for combination treatments vs all other treatments, d.f.=8.

References

    1. Snuderl M, Fazlollahi L, Le LP, Nitta M, Zhelyazkova BH, Davidson CJ et al. Mosaic amplification of multiple receptor tyrosine kinase genes in glioblastoma. Cancer Cell 2011; 20: 810–817. - PubMed
    1. Sottoriva A, Spiteri I, Piccirillo SG, Touloumis A, Collins VP, Marioni JC et al. Intratumor heterogeneity in human glioblastoma reflects cancer evolutionary dynamics. Proc Natl Acad Sci USA 2013; 110: 4009–4014. - PMC - PubMed
    1. Meyer M, Reimand J, Lan X, Head R, Zhu X, Kushida M et al. Single cell-derived clonal analysis of human glioblastoma links functional and genomic heterogeneity. Proc Natl Acad Sci USA 2015; 112: 851–856. - PMC - PubMed
    1. Akhavan D, Pourzia AL, Nourian AA, Williams KJ, Nathanson D, Babic I et al. De-repression of PDGFRbeta transcription promotes acquired resistance to EGFR tyrosine kinase inhibitors in glioblastoma patients. Cancer Discov 2013; 3: 534–547. - PMC - PubMed
    1. Kim J, Lee IH, Cho HJ, Park CK, Jung YS, Kim Y et al. Spatiotemporal evolution of the primary glioblastoma genome. Cancer Cell 2015; 28: 318–328. - PubMed