. 2017 Jul;49(7):1005-1014.
doi: 10.1038/ng.3866. Epub 2017 May 15.

PGBD5 promotes site-specific oncogenic mutations in human tumors

Affiliations

PGBD5 promotes site-specific oncogenic mutations in human tumors

Anton G Henssen et al. Nat Genet. 2017 Jul.

Erratum in

  • Erratum: PGBD5 promotes site-specific oncogenic mutations in human tumors.
    Henssen AG, Koche R, Zhuang J, Jiang E, Reed C, Eisenberg A, Still E, MacArthur IC, Rodríguez-Fos E, Gonzalez S, Puiggròs M, Blackford AN, Mason CE, de Stanchina E, Gönen M, Emde AK, Shah M, Arora K, Reeves C, Socci ND, Perlman E, Antonescu CR, Roberts CWM, Steen H, Mullen E, Jackson SP, Torrents D, Weng Z, Armstrong SA, Kentsis A. Henssen AG, et al. Nat Genet. 2017 Sep 27;49(10):1558. doi: 10.1038/ng1017-1558b. Nat Genet. 2017. PMID: 28951624 No abstract available.
  • Author Correction: PGBD5 promotes site-specific oncogenic mutations in human tumors.
    Henssen AG, Koche R, Zhuang J, Jiang E, Reed C, Eisenberg A, Still E, MacArthur IC, Rodríguez-Fos E, Gonzalez S, Puiggròs M, Blackford AN, Mason CE, de Stanchina E, Gönen M, Emde AK, Shah M, Arora K, Reeves C, Socci ND, Perlman E, Antonescu CR, Roberts CWM, Steen H, Mullen E, Jackson SP, Torrents D, Weng Z, Armstrong SA, Kentsis A. Henssen AG, et al. Nat Genet. 2020 Nov;52(11):1265. doi: 10.1038/s41588-020-00711-z. Nat Genet. 2020. PMID: 32918070

Abstract

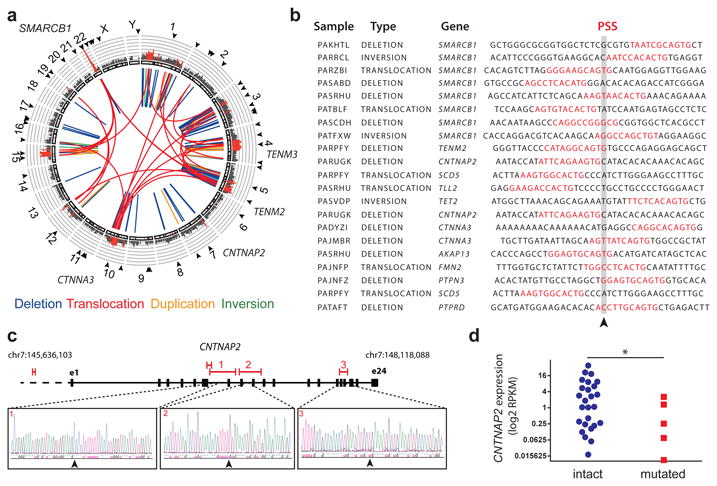
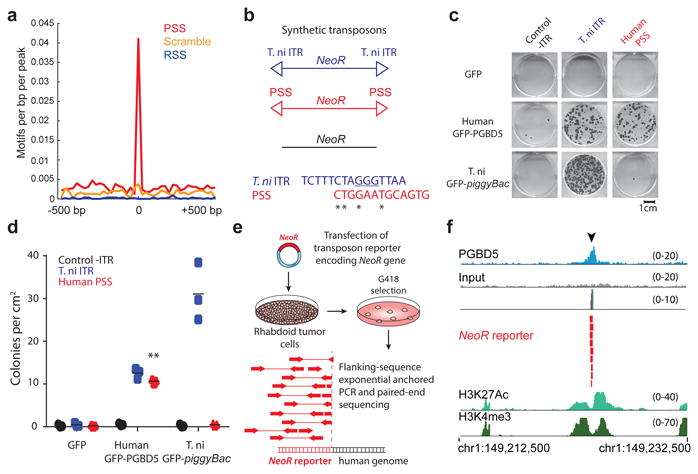
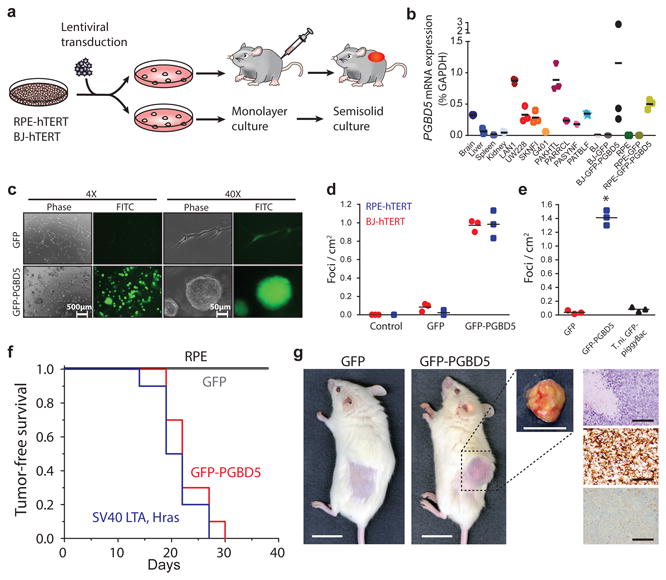
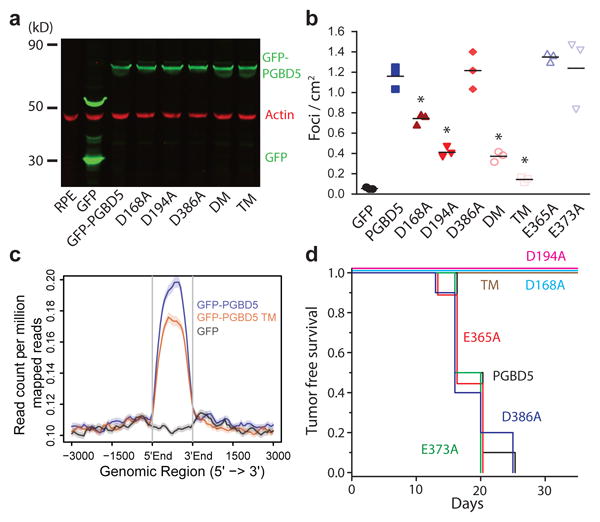
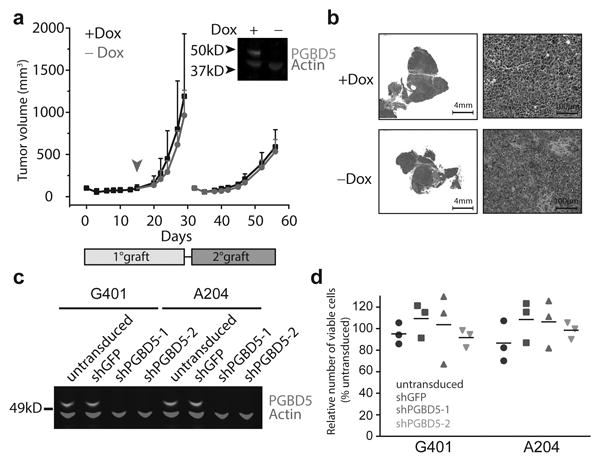
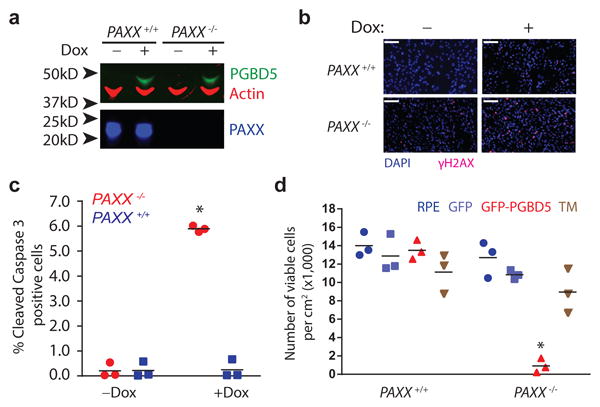
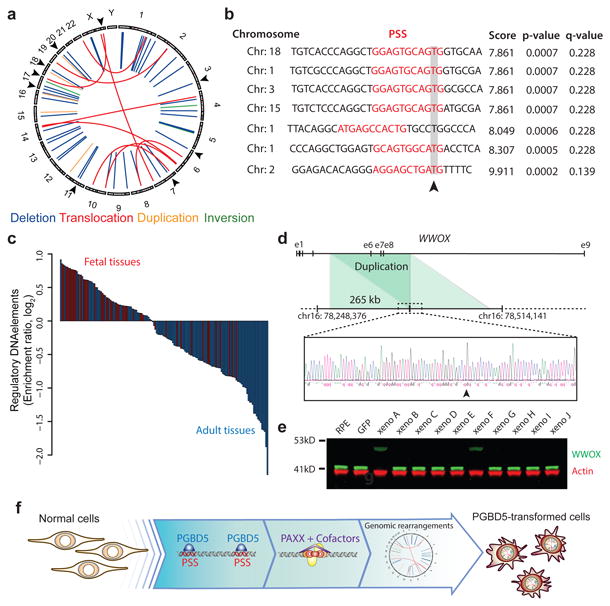
Genomic rearrangements are a hallmark of human cancers. Here, we identify the piggyBac transposable element derived 5 (PGBD5) gene as encoding an active DNA transposase expressed in the majority of childhood solid tumors, including lethal rhabdoid tumors. Using assembly-based whole-genome DNA sequencing, we found previously undefined genomic rearrangements in human rhabdoid tumors. These rearrangements involved PGBD5-specific signal (PSS) sequences at their breakpoints and recurrently inactivated tumor-suppressor genes. PGBD5 was physically associated with genomic PSS sequences that were also sufficient to mediate PGBD5-induced DNA rearrangements in rhabdoid tumor cells. Ectopic expression of PGBD5 in primary immortalized human cells was sufficient to promote cell transformation in vivo. This activity required specific catalytic residues in the PGBD5 transposase domain as well as end-joining DNA repair and induced structural rearrangements with PSS breakpoints. These results define PGBD5 as an oncogenic mutator and provide a plausible mechanism for site-specific DNA rearrangements in childhood and adult solid tumors.


Figures

Fig. 1
Fig. 1. Human rhabdoid tumors exhibit genomic rearrangements associated with PGBD5-specific signal sequence breakpoints
(a) Aggregate Circos plot of somatic structural variants identified in 31 human rhabdoid tumors using laSV, as marked for PSS-containing breakpoints (outer ring, arrowheads), recurrence (middle ring histogram, rearrangements occurring in ≥3 out of 31 samples and highlighted in red for rearrangements with recurrence frequency greater than 13%), and structural variant type (inner lines, as color-labeled). Recurrently rearranged genes are labeled. (b) Representation of 21 structural variant breakpoints in rhabdoid tumors identified to harbor PSS sequences (red) within 10 bp of the breakpoint junction (arrowhead). (c) Recurrent structural variants of CNTNAP2 (red) with gene structure (black) and Sanger sequencing of the rearrangement breakpoints. (d) CNTNAP2 mRNA expression in primary rhabdoid tumors as measured using RNA sequencing in CNTNAP2 mutant (red) as compared to CNTNAP2 intact (blue) specimens (* p = 0.017 by t-test for intact vs. mutant CNTNAP2).
Fig. 2
Fig. 2. PGBD5 is physically associated with human genomic PSS sequences that are sufficient to mediate DNA rearrangements in rhabdoid tumor cells
(a) Genomic distribution of PGBD5 protein in G401 rhabdoid tumor cells as a function of enrichment of PSS (red) as compared to scrambled PSS (orange) and RAG1 recombination signal sequence (RSS, blue) controls as measured using PGBD5 ChIP-seq (p = 2.9 × 10⁻²⁹ for PSS, p = 0.28 for scrambled PSS, p = 1.0 for RSS by hypergeometric test). (b) Schematic of synthetic transposon substrates used for DNA transposition assays, including transposons with T. ni ITR marked by triangles in blue, transposons with PGBD5-specific signal sequence (PSS) marked by triangles in red and transposons lacking ITRs marked in black (top) and sequence alignment of T. ni ITR compared to human PSS (bottom). (c) Representative photographs of Crystal violet-stained colonies obtained upon G418 selection in the transposon reporter assay. (d) Genomic DNA transposition assay as measured using neomycin resistance clonogenic assays in HEK293 cells co-transfected with human GFP-PGBD5 or control GFP and T.ni GFP-PiggyBac, and transposon reporters encoding the neomycin resistance gene flanked by human PSS (red), as compared to control reporters lacking inverted terminal repeats (-ITR, black) and T. ni piggyBac ITR (blue). ** p = 5.0 × 10⁻⁵. Lepidopteran T. ni PiggyBac DNA transposase and its piggyBac ITR serve as specificity controls. Errors bars represent standard deviations of three independent experiments. (e) Schematic model of transposition reporter assay in G401 rhabdoid tumor cells followed by flanking sequence exponential anchored-polymerase chain reaction (FLEA-PCR) and Illumina paired-end sequencing. (f) Genomic integration of synthetic NeoR transposons (red) by endogenous PGBD5 in G401 rhabdoid tumor cells at PSS site (arrowhead), as shown in the ChIP-seq genome track of PGBD5 (blue), as compared to its sequencing input (gray), and H3K27Ac and H3K4me3 (bottom), consistent with the bound PGBD5 transposase protein complex.
Fig. 3
Fig. 3. Ectopic expression of PGBD5 in human cells leads to oncogenic transformation both in vitro and in vivo
(a) Schematic for testing transforming activity of PGBD5. (b) Relative PGBD5 mRNA expression measured by quantitative RT-PCR in normal mouse tissues (brain, liver, spleen and kidney), as compared to human tumor cell lines (rhabdoid G401, neuroblastoma LAN1 and SK-N-FI, medulloblastoma UW-228 cells), primary human rhabdoid tumors (PAKHTL, PARRCL, PASYNF, PATBLF), and BJ and RPE cells stably transduced with GFP-PGBD5 and GFP. Error bars represent standard deviations of 3 independent measurements. (c) Representative images of GFP-PGBD5-transduced RPE cells grown in semisolid media after 10 days of culture, as compared to control GFP-transduced cells. (d) Number of refractile foci formed in monolayer cultures of RPE and BJ cells expressing GFP-PGBD5 or GFP, as compared to non-transduced cells (p = 3.6 × 10⁻⁵ and 3.9 × 10⁻⁴ for GFP-PGBD5 vs. GFP for BJ and RPE cells, respectively). (e) Expression of T. ni GFP-PiggyBac does not lead to the formation of anchorage independent foci in monolayer culture (* p = 3.49 × 10⁻⁵ for GFP-PGBD5 vs. T. ni GFP-PiggyBac). Error bars represent standard deviations of 3 independent experiments. (f) Kaplan-Meier analysis of tumor-free survival of mice with subcutaneous xenografts of RPE cells expressing GFP-PGBD5 or GFP control, as compared to non-transduced cells or cells expressing SV40 large T antigen (LTA) and HRAS (n = 10 mice per group, p < 0.0001 by log-rank test). (g) Representative photographs (from left) of mice with shaved flank harboring RPE xenografts (scale bar = 1 cm). Tumor excised from mouse harboring GFP-PGBD5 expressing tumor (scale bar = 1 cm). Photomicrograph of GFP-PGBD5 expressing tumor (top to bottom: hematoxylin and eosin stain, vimentin, and cytokeratin, scale bar = 1 mm).
Fig. 4
Fig. 4. PGBD5 transposase activity is necessary to transform human cells
(a) Western blot of GFP in RPE cells expressing GFP-PGBD5, GFP-PGBD5 mutants, and GFP compared to RPE cells (DM = double mutant D194A/D386A; TM = triple mutant D168A/D194A/D386A). (b) Number of refractile foci formed in monolayer culture in RPE and BJ cells stably expressing GFP-PGBD5 or control GFP, as compared to non-transduced cells and cells expressing GFP-PGBD5 mutants (red = transposase deficient mutants, blue = transposase proficient mutants, * p = 2.1 × 10⁻⁴ for D168A vs. GFP-PGBD5, p = 2.7 × 10⁻⁶ for D194A vs. GFP-PGBD5, p = 1.8 × 10⁻⁶ for D194A/D386A vs. GFP-PGBD5, p = 2.4 × 10⁻⁷ for D168A/D194A/D386A vs. GFP-PGBD5). Error bars represent standard deviations of 3 independent experiments. (c) Composite plot of ChIP-seq of GFP-PGBD5 (green), as compared to the GFP-PGBD5 D168A/D194A/D386A catalytic TM mutant (orange) and GFP control (purple). (d) Kaplan-Meier analysis of tumor-free survival of mice with subcutaneous xenografts of RPE cells expressing GFP-PGBD5 as compared to cells expressing GFP-PGBD5 mutants (n = 10 per group, p < 0.0001 by log-rank test).
Fig. 5
Fig. 5. Transient PGBD5 transposase expression is sufficient to transform human cells
(a) Tumor volume of RPE cells as a function of time in primary (light gray box) and secondary (dark gray box) transplants, with PGBD5 expression induced using doxycycline (black), as indicated. RPE cells were treated with doxycycline in vitro for 10 days prior to transplantation. Arrowhead denotes withdrawal of doxycycline from the diet (red). Inset: Western blot of PGBD5 protein, as compared to actin control in cells derived from tumors after primary transplant. (b) Representative photomicrographs of hematoxylin and eosin stained tumor sections from doxycycline-inducible PGBD5-expressing RPE tumors after continuous (+Dox) and discontinuous (-Dox) doxycycline treatment. (c) Western blot of PGBD5 in G401 and A204 rhabdoid tumor cells upon depletion of PGBD5 using two independent shRNAs, as compared to non-transduced cells and control cells expressing shGFP. (d) Relative number of viable G401 and A204 cells upon 72 hours of PGBD5 shRNA depletion. Errors bars represent standard deviations of 3 independent experiments.
Fig. 6
Fig. 6. DNA end-joining repair is required for survival of cells expressing active PGBD5
(a) Western blot of PGBD5 protein after 24 h of doxycycline (500 ng/ml) treatment of isogenic PAXX+/+ and PAXX-/- RPE cells stably expressing doxycycline-inducible PGBD5. (b) Representative photomicrograph of PAXX+/+ and PAXX-/- RPE cells after 48 h treatment with doxycycline (500 ng/ml) or vehicle control stained for DAPI (blue) and γH2AX (red). Scale bar = 100 μm. (c) Fraction of apoptotic cells as measured by cleaved caspase-3 staining and flow cytometric analysis of PAXX+/+ and PAXX-/- RPE cells after treatment with doxycycline or vehicle control. * p = 8.7 × 10⁻⁴ for PAXX+/+ vs. PAXX-/- with doxycycline. (d) Number of viable PAXX+/+ and PAXX-/- RPE cells per cm2 in monolayer culture as measured by Trypan blue staining after 48 h of expression of GFP-PGBD5, as compared to GFP-PGBD5 D168A/D194A/D386 mutant and GFP-expressing control cells. * p = 7.4 × 10⁻⁵ for PAXX-/- GFP-PGBD5 vs. GFP control. Error bars represent standard deviations of 3 independent experiments.
Fig. 7
Fig. 7. PGBD5-induced cell transformation involves site-specific genomic rearrangements associated with PGBD5-specific signal sequence breakpoints
(a) Circos plot of structural variants discovered in RPE-GFP-PGBD5 tumor cells using assembly-based genome analysis. Black arrows on outer circle indicate the presence of PSS at variant breakpoints. (b) Representation of 7 breakpoints identified to harbor PSS sequences (red) within 10 bp of the breakpoint junction (arrowhead) of structural variants in PGBD5 expressing RPE cells. Genomic sequence is annotated 5′ to 3′ as presented in the reference genome (+) strand. (c) Waterfall plot of enrichment of ENCODE regulatory DNA elements with structural variants in fetal (red) as compared to adult tissues (blue) in PGBD5-transformed RPE cells (p = 5.7 × 10⁻⁸). (d) Schematic of the WWOX gene and its intragenic duplication in GFP-PGBD5-transformed RPE cells (top), with Sanger sequencing chromatogram of the rearrangement breakpoint (bottom). Arrowhead marks the breakpoint. (e) Western blot analysis of WWOX in 10 independent GFP-PGBD5-transformed RPE cell tumor xenografts, as compared to control GFP-transduced and non-transduced RPE cells. Actin serves as loading control. (f) Schematic model of the proposed mechanism of PGBD5-induced cell transformation, involving association of PGBD5 with genomic PSS sequences, their remodeling dependent on PAXX-meditated end-joining DNA repair, and generation of tumorigenic genomic rearrangements.

Similar articles

Cited by

References

    1. Vogelstein B, et al. Cancer genome landscapes. Science. 2013;339:1546–1558. doi: 10.1126/science.1235122. - DOI - PMC - PubMed
    1. Alexandrov LB, et al. Signatures of mutational processes in human cancer. Nature. 2013;500:415–421. doi: 10.1038/nature12477. - DOI - PMC - PubMed
    1. Cancer Genome Atlas Research N et al. The Cancer Genome Atlas Pan-Cancer analysis project. Nature genetics. 2013;45:1113–1120. doi: 10.1038/ng.2764. - DOI - PMC - PubMed
    1. Futreal PA, et al. A census of human cancer genes. Nature reviews Cancer. 2004;4:177–183. doi: 10.1038/nrc1299. - DOI - PMC - PubMed
    1. Huether R, et al. The landscape of somatic mutations in epigenetic regulators across 1,000 paediatric cancer genomes. Nature communications. 2014;5:3630. doi: 10.1038/ncomms4630. - DOI - PMC - PubMed

MeSH terms