. 2017 Jun;19(6):603-613.
doi: 10.1038/ncb3532. Epub 2017 May 15.

Wounding induces dedifferentiation of epidermal Gata6+ cells and acquisition of stem cell properties

Affiliations

Wounding induces dedifferentiation of epidermal Gata6+ cells and acquisition of stem cell properties

Giacomo Donati et al. Nat Cell Biol. 2017 Jun.

Abstract

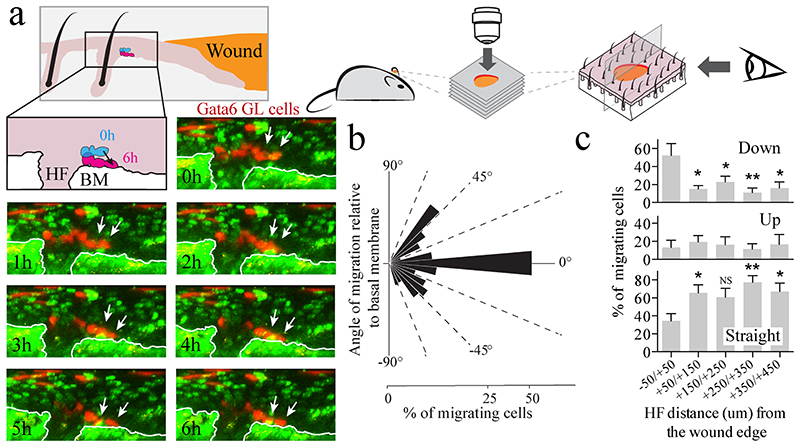
The epidermis is maintained by multiple stem cell populations whose progeny differentiate along diverse, and spatially distinct, lineages. Here we show that the transcription factor Gata6 controls the identity of the previously uncharacterized sebaceous duct (SD) lineage and identify the Gata6 downstream transcription factor network that specifies a lineage switch between sebocytes and SD cells. During wound healing differentiated Gata6+ cells migrate from the SD into the interfollicular epidermis and dedifferentiate, acquiring the ability to undergo long-term self-renewal and differentiate into a much wider range of epidermal lineages than in undamaged tissue. Our data not only demonstrate that the structural and functional complexity of the junctional zone is regulated by Gata6, but also reveal that dedifferentiation is a previously unrecognized property of post-mitotic, terminally differentiated cells that have lost contact with the basement membrane. This resolves the long-standing debate about the contribution of terminally differentiated cells to epidermal wound repair.


Figures

Figure 1
Figure 1. Identification of Gata6 as a marker of the sebaceous duct lineage
a. Wild type (WT) and K14ΔNLef1 hair follicles from back skin labelled with anti- Lrig1 antibody. Asterisk indicates nonspecific staining of hair shaft. b, DNA motif enrichment analysis on the promoters of up-regulated genes in K14ΔNLef1 vs WT epidermal cells and in WT Lrig1+ cells. TF = Transcription Factor. c, WT and K14ΔNLef1 back skin sections stained for Krt14 and Gata6. d, Gata6 expression in the JZ/SD. Gata6-tdTomato reporter epidermal tail whole mount showing tdTomato and lipid labeling. e, Back skin section of WT hair follicle stained with antibodies to Gata6 and Itga6 (bottom panel). f, Gene Ontology enrichment analysis of Gata6 direct target genes is dependent on the distance between the transcription start sites (TSS) and Gata6 ChIP-Seq peaks. Kbp=kilobase pair. g-i, Overexpression of Gata6 decreases proliferation rate and promotes cell migration. g, h % confluence (g) and % scratch wound re-epithelialisation (h) of mouse primary keratinocytes infected with empty vector or Gata6 lentivirus. Data are means of n=4 (g) or n=3 (h) independent replicates ± s.e.m. Representative images from n=2 independent experiments of scratch wound assay are shown (i). Scale bars: 50 μm [AU: in fig.2 is not clear whether the panels below (e) and (f) belong to (e), (f) or represent an independent panel altogether. Please clarify restructuring or adding labels to the figure. Error bars for some of the panels are missing too (e.g. magnification in Fig.2f, etc). Please also specify how many experiments the images are representative of.]
Figure 2
Figure 2. Architectural characterization of the junctional zone
a, Flow sorting of basal JZ/SD cells (green), suprabasal duct cells (violet), bulge cells (yellow) and all remaining basal cells (grey) (see schematic in b). b, c, Transcriptome analysis of the 4 sorted populations from (a) (n=3 mice) and Gene Ontology analysis of the 3 gene clusters highlighted in the heat map (c). d-f, Gata6 positive cells express the late differentiation markers Blimp1 (d) and Krt79 (e) and the early differentiation marker Fabp5 (f, g). Wild type skin sections were stained with the antibodies shown. Boxed areas are shown at higher magnification. Single fluorescent channel images are also shown (g). Red arrows mark Fabp5-positive basal cells; yellow arrows Fabp5-negative basal cells in the JZ/SD and IFE (g). Basal Gata6+ cells in the JZ/SD coexpress Fabp5 (red arrow and framed magnification view of the Fabp5 single fluorescent channel) while some Gata6- cells do not (yellow arrow and framed magnification view of the Fabp5 single fluorescent channel). Representative images of n=3 independent experiments. h, Wild type back skin sections in telogen (left panel) and anagen (central panel) stained for Gata6 and Ki67. Right hand panels show single fluorescent channel images at higher magnification (from left: DAPI, Gata6, Ki67) of the white inserts. Representative images of n=3 independent experiments i, Schematic of Gata6 expressing cells in the JZ/SD area. Dashed lines demarcate epidermal-dermal boundaries. Scale bars: 50 μm (d,h), 25 μm (e-g).
Figure 3
Figure 3. Gata6 controls the identity of the sebaceous duct (SD) lineage and distinguishes the sebocyte and SD lineages
a, Flow cytometry analysis (dot plots and quantification) of basal JZ cells (Itga6+Gata6+), differentiated SD cells (Itga6-Gata6+) and bulge cells (Itga6+Cd34+), shows loss of the Gata6 expressing duct lineage upon genetic ablation of Gata6. Data are means ± s.d. from n=3 mice. *P<0.05, by unpaired Student’s t-test. b, Heat map representing hierarchical clustering of differentially expressed genes in microdissected interfollicular epidermis (IFE), hair follicle (HF) and sebaceous gland (SG) (see schematic) (n=3 biological replicates). c, d mRNA expression of markers specific for different cell compartments in Gata6 overexpressing primary keratinocytes compared with empty vector control cells collected at the indicated number of days following calcium-induced differentiation (c) or hours following suspension-induced differentiation (d). Heat map (log2 fold change = FC) (c) and RT-qPCR (d) are shown. Data are means ± s.d. from n=3 independent biological replicates. e, Cytoscape visualization of the Gata6-centric transcription factor network built by merging the features identified by different genomic approaches (see Methods). Magnification of selected elements from SG and JZ/SD sub-networks is shown. f, Plots of ChIP-Seq reads aligned to the Ar and Blimp1 loci identifying them as Gata6 direct targets. g, Blimp1 is induced while Ar is repressed by Gata6 overexpression. RT-qPCR of mRNAs from Gata6 overexpressing or control (empty vector) primary mouse keratinocytes collected at the indicated number of days after switching to high calcium medium. Data are means ± s.d. from n=3 independent biological samples.
Figure 4
Figure 4. Fate of Lrig1 and Gata6 lineages during wound healing
a, Sections of skin close to a wound (left panels - tail) or at the wound edges (right panels - back) stained with antibodies to Gata6, Lrig1 and tdTomato showing the fate of Gata6 (top panels) and Lrig1 (bottom panels) genetically labeled (GL) cells in the early stage of re-epithelialization 3 days after wounding. Representative images of n=3 independent experiments. b, Schematic and quantification of cells exiting the JZ of the HF and migrating into the IFE wound site. The presence of labelled basal and suprabasal cells in ten IFE positions (from “a” to “l”) is shown. Cell position “a” is assigned to the first IFE nucleus out of the HF as indicated by a straight yellow line and yellow arrow in the left panels in (a). Data are means ± s.e.m. from n=3 (Lrig1, HF=24) or n=4 (Gata6, HF=30) lineage-traced mice. c, d, Whole mounts of tail epidermis showing the contribution of Gata6 (c) and Lrig1 (d) tdTomato GL cells to wound healing. Right panels are higher magnification views. Representative images of n=3 independent experiments. e, f, Invasion of Gata6 GL cells into uninjured epithelial HF niches (white arrows) close to the wound site. Left hand panels show SG cross sections while right hand panels show tail epidermal whole mounts. Gata6 tdTomato GL cells in late stages of re-epithelialization in IFE wound proximity (f) or in distant areas (e). Asterisk indicates Gata6 GL cells involved in IFE re-epithelialization. Yellow brackets indicate the bulge areas. Representative images of n=3 independent experiments. g, Percentage of tdTomato+ lower SG close to or far from the wound, determined from histological sections of back skin. Data are means ± s.d. from 3 mice (48 SG). Dashed lines indicate epidermal-dermal boundary (a) or SG (e, f). Scale bars: 50 μm.
Figure 5
Figure 5. Dedifferentiation of Gata6 lineage SD cells and acquisition of stem cell properties
a, Tail skin sections 28 days after wounding stained with antibodies to Gata6 or Lrig1 showing the fate of Gata6 (left panel) and Lrig1 (right panel) tdTomato labeled cells. Both cell populations colonize the IFE wound bed. Gata6 labeled cells close to the wound also invade uninjured niches in HF and lower SG (white arrows), while further from the wound (yellow arrows) they remain in the JZ and SD. b, c, Sections of tail skin stained with antibodies to Itga6 and tdTomato. Two days after tamoxifen treatment (day 0 of wounding) of Gata6EGFPCreERT2 Rosa26-fl/STOP/fl-tdTomato tail skin, differentiated suprabasal JZ/SG duct cells are labeled (top left panel in b). By day 6 differentiated JZ/SD cells have left the HF and are migrating suprabasally (b); by day 12 they are present in the basal layer of the wound bed (b). In contrast, Lrig1 genetically labeled (GL) cells exit the JZ as basal and suprabasal cells (c). Boxed regions (b, c) are also shown at higher magnification. d, Quantification of basal tdTomato labeled cells derived from the Gata6 or Lrig1 lineage at the indicated time points in tail skin after wounding. Box-and-whisker plots: mid-line, median; box, 25th to 75th percentiles; and whiskers, minimum and maximum. Data are from n=3 to n=4 mice per time point (average of 10 wound bed sections per time point). e, Sections of re-epithelized tail IFE showing tdTomato Gata6 GL cells stained with antibodies to Ki67. f, g, Wound bed tail skin sections showing columns of IFE cells derived from dedifferentiation of Gata6 GL cells (tdTomato) stained with Krt14 (f) and Ki67(g). Ki67 quantification at the indicated time points is shown. Data are means ± s.e.m. from n=6 to n=17 epidermal proliferative unit (EPU) per time point. **P<0.005, by unpaired Student’s t-test. Dashed lines indicate dermal-epidermal junction. ND = not detected. Scale bars: 50 μm (a-c); 25 μm (e–g).
Figure 6
Figure 6. Contribution of Gata6+ cells to reconstituted skin
a, Epidermal cells isolated from the back skin of Gata6-tdTomato reporter/GFP-expressing adult mice in telogen were sorted into differentiated Gata6+ cells (Itga6 low/tdTomato positive; blue gate) and Itga6 high (red gate) cells. These two populations were compared in a skin reconstitution assay. b, Chamber in place one 1 week after implantation. c, d, Grafts containing differentiated Gata6+ cells and epidermal stem cell enriched Itga6 high cells showed similar numbers of reconstituted hair follicles after 5 weeks. Macroscopic views of representative grafts (left panels) and quantification (right panel) are shown (N=3 Itga6 high; N=6 differentiated Gata6 cells). Data are means ± s.d e, f, Dedifferentiation of Gata6+ cells in grafts. Graft skin sections were stained for Gfp (green) and Krt14 (red). Higher magnification views and single fluorescent channel images of the white inserts are shown. Yellow arrows indicate Gfp positive basal cells derived from Gata6+ or Itga6 high sorted cells in the interfollicular epidermis. Dashed lines demarcate epidermal-dermal boundaries. Representative images from n=3 to n=6 chamber graft assays (Itga6 high and Itga6 low/tdTomato positive cells respectively). Scale bars: 25 μm.
Figure 7
Figure 7. Live imaging of suprabasal Gata6 GL cells migrating to the basal layer during wound healing.
a, Time lapse live imaging strategy (top) for visualizing suprabasal Gata6 GL cells migrating towards the wound edge in ear skin. Bottom: a series of Z stacks was taken each hour and the orthogonal images were reconstructed to follow the migration angle with respect to the basal membrane (collagen). Downward migration of Gata6 GL cells (white arrows) is shown: orthogonal images at the indicated time points from the beginning of image acquisition showing GL cells (red) and nuclei, collagen (green). White lines indicate the basal membrane. Transition from suprabasal to basal layer is summarised schematically. Scale bars: 25 μm. b, Quantification of the angle of migration (bins of 10 degrees) with respect to the basement membrane of all the migratory events of the GL Gata6 cells per HF detected in n=6 mice (49 HF, 670 cells) during time lapse imaging for 12.5±3.8 hours. c, Percentage of labelled cells at the indicated distances from the wound edge showing downward (-90/-10 degrees), straight (-10/+10 degrees) or upward (+10/+90 degrees) migration. From n=7 to n=12 hair follicles per bin. Data are means ± s.e.m. *P<0.05; **P<0.005, by unpaired Student’s t-test.
Figure 8
Figure 8. Wound induced plasticity of Gata6 lineage linked to loss of JZ identity and acquisition of multi-lineage differentiation potential
a, Sections of tail skin at the indicated time points after wounding showing tdTomato labelled cells, derived from differentiated Gata6 SD cells, stained with antibodies to the SD markers Krt79 and Plet1. White arrows indicate rare Krt79+ cells at the wound edge. Representative images of n=3 independent experiments. b, Wound bed section of tdTomato labeled columns of IFE cells derived from differentiated SD cells, stained with antibodies to scale (Krt31) and interscale (Filaggrin - Flg) markers. The percentage of IFE cell columns (EPU) labelled with antibodies to Krt31 and Flg is shown for Gata6 GL and Lrig1 GL cells (bottom panel). N=5 mice (39-41 EPU). Data are means ± s.e.m. *P<0.05, by unpaired Student’s t-test. c, Sections of tail skin showing Gata6 GL cells invading uninjured niches. Co-expression of tdTomato and the lower HF markers Lef1 and Krt31 or lipid marker of differentiated sebocytes (white arrow) is shown. Representative images of n=3 independent experiments. Dashed or solid lines indicate dermal-epidermal boundary Scale bars: 25 μm.

References

    1. Tata PR, et al. Dedifferentiation of committed epithelial cells into stem cells in vivo. Nature. 2013;503:218–223. - PMC - PubMed
    1. van Es JH, et al. Dll1+ secretory progenitor cells revert to stem cells upon crypt damage. Nature cell biology. 2012;14:1099–1104. - PMC - PubMed
    1. Page ME, Lombard P, Ng F, Gottgens B, Jensen KB. The epidermis comprises autonomous compartments maintained by distinct stem cell populations. Cell stem cell. 2013;13:471–482. - PMC - PubMed
    1. Donati G, Watt FM. Stem cell heterogeneity and plasticity in epithelia. Cell stem cell. 2015;16:465–476. - PubMed
    1. Tetteh PW, Farin HF, Clevers H. Plasticity within stem cell hierarchies in mammalian epithelia. Trends in cell biology. 2015;25:100–108. - PubMed

Publication types

MeSH terms

Substances