Comparative Study
. 2017 Jun;19(6):614-625.
doi: 10.1038/ncb3529. Epub 2017 May 15.

The mitochondrial respiratory chain is essential for haematopoietic stem cell function

Affiliations
Comparative Study

The mitochondrial respiratory chain is essential for haematopoietic stem cell function

Elena Ansó et al. Nat Cell Biol. 2017 Jun.

Abstract

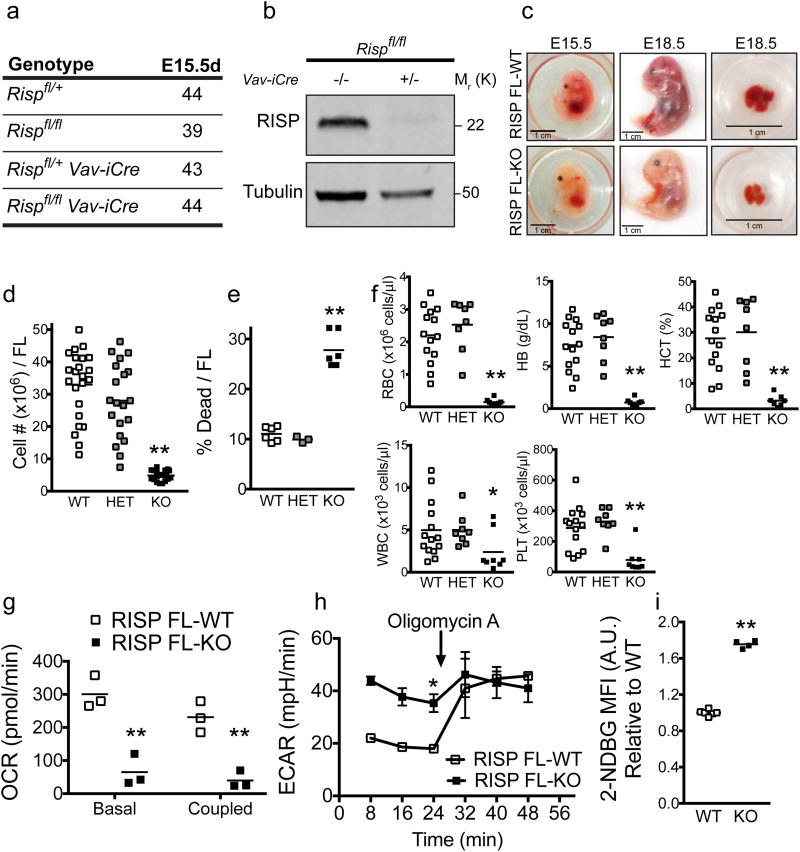
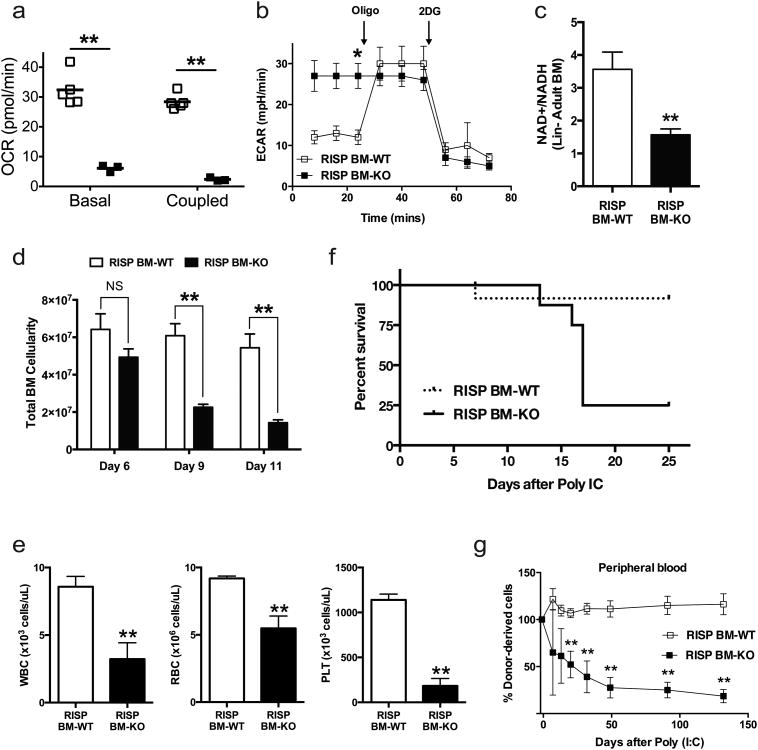
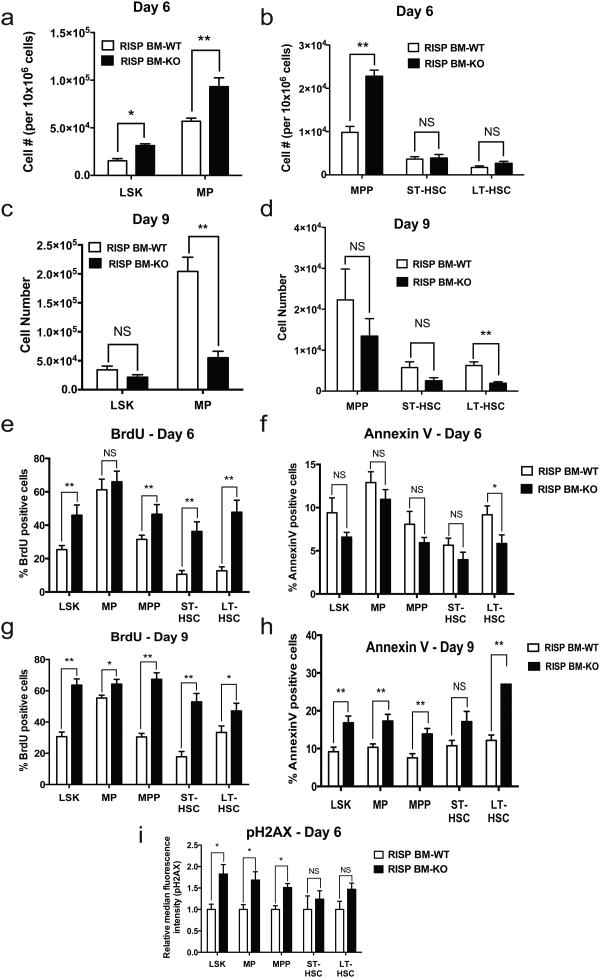
Adult and fetal haematopoietic stem cells (HSCs) display a glycolytic phenotype, which is required for maintenance of stemness; however, whether mitochondrial respiration is required to maintain HSC function is not known. Here we report that loss of the mitochondrial complex III subunit Rieske iron-sulfur protein (RISP) in fetal mouse HSCs allows them to proliferate but impairs their differentiation, resulting in anaemia and prenatal death. RISP-null fetal HSCs displayed impaired respiration resulting in a decreased NAD+/NADH ratio. RISP-null fetal HSCs and progenitors exhibited an increase in both DNA and histone methylation associated with increases in 2-hydroxyglutarate (2HG), a metabolite known to inhibit DNA and histone demethylases. RISP inactivation in adult HSCs also impaired respiration resulting in loss of quiescence concomitant with severe pancytopenia and lethality. Thus, respiration is dispensable for adult or fetal HSC proliferation, but essential for fetal HSC differentiation and maintenance of adult HSC quiescence.


Figures

Figure 1
Figure 1. Loss of RISP in hematopoietic cells impairs mitochondrial oxidative metabolism and results in severe fetal anemia
(a) Genotypes from crosses between Rispfl/fl and Rispfl/fl Vav-iCre mice. (b) Protein expression of RISP in lineage negative (Lin- ) fetal liver cells analyzed by Western blot. The experiment was performed three times. The figure displayed is one representative experiment. Image of the whole blot is displayed in Supplementary Fig. 8. (c) Representative pictures at E15.5 and E18.5 days of Rispfl/fl and Rispfl/fl Vav-iCre fetuses, and fetal livers at E18.5 days. (d) Total cell number per fetal liver (FL) at E15.5 days. (WT n=23; HET n=20; KO n=20). (e) Percentage of cell death per FL at E15.5 days. (WT n=6; HET n=3; KO n=6). (f) Peripheral blood cell parameters from E18.5 days embryos, including RBC (red blood cells), HB (hemoglobin), HCT (hematocrit), WBC (white blood cells) and PLT (platelets) (WT n=14; HET n=8; KO n=8). (g) Oxygen consumption rate (OCR) of Lin- FL cells in basal and coupled conditions. (WT n=3; KO n=3). (h) Extracellular acidification rate (ECAR) of Lin- FL cells in basal conditions and after exposure to 1 μM oligomycin A. Figure is representative of three independent experiments. (WT n=3; KO n=3). (i) 2-NBDG uptake in Lin- FL cells. Results are expressed as relative to WT (WT n=6; KO n=4), Data in Figure 1 are mean ± SEM. *p ≤ 0.05; **p ≤ 0.01. All p values calculated using Student's t-test.
Figure 2
Figure 2. RISP is essential for fetal HSC differentiation
(a) Total number of HSCs per FL at E15.5d and E17.5d in RISP FL-WT and FL-KO mice (E15.5 WT n=19 and KO n=6; E17.5 WT n=8 and KO n=7). (b) Total number of MPPs per FL at E15.5d and E17.5d in RISP FL-WT and FL-KO mice (E15.5 WT n=19 and KO n=7; E17.5 WT n=6 and KO n=7). (c) 2-NDBG MFI of FL HSCs at E15.5d in RISP FL-WT and FL-KO mice. Results are expressed as relative to WT (WT n=6; KO n=7). (d) Percentage of BrdU-positive FL HSCs from E15.5d in RISP FL-WT and FL-KO mice (WT n=6; KO n=5). (e) Percentage of annexin V positive FL HSCs from E15.5d in RISP FL-WT and FL-KO mice (WT n=6; KO n=9). (f) MitoSox and DCFH MFI of FL HSCs from E15.5d in RISP FL-WT and FL-KO mice. Results are expressed as relative to WT (MitoSOX WT n=4; KO n=6) (DCFH WT n=8; KO n=6). (g) TMRE and MTG MFI of FL HSCs from E15.5d in RISP FL-WT and FL-KO mice. TMRE values were CCCP corrected. Results are expressed as relative to WT (TMRE WT n=4; KO n=6) (MTG WT n=11; KO n=12). (h) Quantification of genes implicated in fetal HSC maintenance from fetal HSC cells isolated from RISP FL-WT and FL-KO mice. Results are expressed as relative fold change of KO compared to WT for sorted HSCs. (WT n=4; KO n=4 or n=3 for HoxA9). Data in Figure 2 are mean ± SEM. *p ≤ 0.05; **p ≤ 0.01. All p values calculated using Student's t-test.
Figure 3
Figure 3. Ablation of RISP depletes fetal myeloid progenitors
(a and b) Frequency and total cell number of MP (myeloid progenitors), CMP (common myeloid progenitor), GMP (granulocyte macrophage progenitor) and MEP (megakaryocyte-erythrocyte progenitor) in fetal livers from RISP FL-WT and FL-KO mice. (WT n=5; KO n=5). (c) Quantitative RT-PCR analysis of pro-myeloid cell lineage commitment genes in MP cells isolated from RISP FL-WT and FL-KO mice. Results are expressed as relative fold change of KO compared to WT. (WT n=7; KO n=7). (d) Cell frequency and cell number of the erythroid population maturation in the fetal defined by staining against surface markers CD71 and Ter119 in RISP FL-WT and FL-KO mice (WT n=13; KO n=11). (e) Cell frequency and cell number of the CD41/CD42 populations from FL cells at E15.5d in RISP FL-WT and FL-KO mice. (WT n=8; KO n=6). (f) Cell frequency and cell number of the Mac-1/Gr-1 populations from FL cells at E15.5d in RISP FL-WT and FL-KO mice. (WT n=8; KO n=6). (g) Quantification of CFU-GM, BFU-E and CFU-GEMM colonies from Methocult cultures of 105 FL RISP WT and KO cells cells under normoxic (21% O2) and hypoxic (1.5% O2) conditions. (WT n=12; KO n=6). (h) Quantification of CFU-Mk colonies from MegaCult-collagen gels of 105 FL RISP WT and KO cells under normoxic (21% O2) and hypoxic (1.5% O2) conditions. (WT n=8; KO n=5). Data in Figure 3 are mean ± SEM. *p ≤ 0.05; **p ≤ 0.01. All p values calculated using Student's t-test.
Figure 4
Figure 4. RISP deficiency impairs fetal HSC competitive repopulation capacity
(a) The total contribution of CD45.2 fetal liver (FL) donor cells to the peripheral blood of irradiated CD45.1 recipient mice in a competitive transplantation assay following engraftment and subsequent Poly (I:C) treatment. Data represent the percentage of CD45.2 donor cells relative to the initial chimerism. (b) The contribution of CD45.2 FL donor cells to specific lineages in the peripheral blood of irradiated CD45.1 recipient mice in a competitive transplantation assay following engraftment and subsequent Poly (I:C) treatment. B-cell lineage (B220+), T-cell lineage (CD3+) and myeloid lineage (Mac-1+, Gr-1+). Data represent the percentage of CD45.2 donor cells relative to the initial chimerism. (c) The contribution of CD45.2 FL donor cells to specific lineages (LSK, ST-HSC, LT-HSC, MPP, MP, CMP, GMP, and MEP) in the bone marrow of irradiated CD45.1 recipient mice in a competitive transplantation assay after engraftment and subsequent Poly (I:C) treatment. Bone marrow was assayed four months post-Poly (I:C) treatment. Data represent the percentage of CD45.2 donor cells relative to the initial chimerism. Data represent the average contribution for Rispfl/fl (RISP FL-WT; n=9 mice) and Rispfl/fl Mx1-Cre (RISP FL-KO; n=4 mice) in Figure 4a-c. Data in Figure 4a-c are mean ± SEM. *p ≤ 0.05; **p ≤ 0.01. All p values calculated using Student's t-test.
Figure 5
Figure 5. Loss of RISP in fetal HSCs leads to deregulation of gene expression, DNA and histone hypermethylation, and histone hypoacetylation
(a-c) Heat map, top enriched gene ontology terms and gene signatures from RNA sequence analysis reveals deregulation of gene expression in RISP null fetal HSCs. RNA sequence analysis was done on fetal HSCs isolated from 3 different RISP FL-WT and FL-KO mice. (d) Percentage of 5-methylcytosine of total cytosine in Lin- fetal liver cells from RISP FL-WT and FL-KO mice. n=4 ± SEM *p ≤ 0.05. p-value calculated using Student's t-test. (e, f) Mass spectrometry-based epigenetic analysis of various histone lysine methylation and acetylation modifications. Data represents the analysis of pooled lin- FL cells from 4 WT and 7 RISP KO animals. Supplementary Table 2 contains the data from a second independent mass spectrometry-based epigenetic analysis using pooled lin- FL cells from 3 WT and 3 RISP KO animals.
Figure 6
Figure 6. Risp deficiency decreases NAD+/NADH ratio and increases 2-HG
(a) The ratio of NAD+/NADH in RISP WT and KO Lin- FL cells. (WT n=12 mice; KO n=7 mice). (b) Concentrations of a-ketoglutarate (αKG), succinate, fumarate, and 2-hydroxyglutrate (2-HG) in RISP WT and KO Lin- FL cells. The cellular concentration of 2-HG in RISP KO Lin- FL cells ranged from 1.75mM to 2.61mM with an average concentration of 2.21mM. (c-e) The ratio of 2-HG, succinate, and fumarate to aKG in RISP WT and KO Lin- FL cells. (f-g) Relative abundance of glycolytic and TCA cycle metabolites extracted from RISP WT and KO Lin- FL cells. Peak areas of each metabolite were normalized to cell number. Metabolites in Figure 6b-h were measured from WT n=7 mice; KO n=5 mice. Raw metabolite data is available as Supplementary Table 3. Data in Figure 6 are mean ± SEM. *p ≤ 0.05; **p ≤ 0.01. All p values calculated using Student's t-test.
Figure 7
Figure 7. Loss of RISP in adult hematopoietic stem cells impairs mitochondrial oxidative metabolism and leads to a severe pancytopenia phenotype
(a) Basal and coupled oxygen consumption rate (OCR) of Lin- BM cells from adult Rispfl/fl (RISP BM-WT) or Rispfl/fl Mx1-Cre (RISP BM-KO) mice 6 days after PolyI:C treatment. Data represent average of RISP BM-WT (n=5) or RISP BM-KO (n=3) ± SEM. (b) Extracellular acidification rate (ECAR) of Lin- BM cells from RISP BM-WT and RISP BM-KO mice 6 days after Poly (I:C) treatment under basal conditions, treatment with 1uM oligomycin A (Oligo) or 20mM 2-deoxy-glucose (2DG). Data represents the average of RISP BM-WT (n=5) or RISP BM-KO (n=3) ± SEM. (c) The ratio of NAD+/NADH in LSK cells sorted from BM of adult RISP BM-WT and RISP BM-KO mice 6 days after Poly (I:C) treatment. Data represent average of RISP BM-WT (n=6) or RISP BM-KO (n=6) ± SEM. (d) Total cellularity of BM taken from two femurs and two tibias for each mouse, either 6, 9 or 11 days after Poly (I:C) treatment. Data represents average of RISP BM-WT (day 6: n=9, day 9: n=6, day 11: n=8 mice) or RISP BM-KO ((day 6: n=10, day 9: n=14, day 11: n=11mice) ± SEM. (e) Peripheral blood cell counts in adult RISP BM-WT or RISP BM-KO mice 13 days after Poly (I:C) treatment. WBC (white blood cells), RBC (red blood cells), PLT (platelets). Data represent average of RISP BM-WT (n=10 mice) or RISP BM-KO (n=8 mice) ± SEM. (f) Survival curve of adult RISP BM-WT or RISP BM-KO mice treated with Poly (I:C). Data represent RISP BM-WT (n=10 mice) or RISP BM-KO (n=9 mice) ± SEM. Surviving RISP BM-KO mice treated with Poly (I:C) failed to delete RISP. (g) Total contribution of CD45.2 bone marrow (BM) donor cells to the peripheral blood of irradiated CD45.1 recipient mice in a competitive transplantation assay following engraftment and subsequent Poly (I:C) treatment. Data represent the percentage of CD45.2 donor cells relative to the initial chimerism. Data represent the average contribution for Rispfl/fl (RISP BM-WT; n=4 mice) and Rispfl/fl Mx1-Cre (RISP BM-KO; n=6 mice). Data in Figure 7 are mean ± SEM. *p ≤ 0.05; **p ≤ 0.01. All p values calculated using Student's t-test.
Figure 8
Figure 8. RISP deficiency in adult HSCs leads to impaired differentiation, loss of quiescence, increased apoptosis and increased DNA damage
(a and b) Cell number (per 10×106 cells) of indicated populations in adult BM of RISP BM-WT or RISP BM-KO mice 6 days after Poly (I:C) treatment. Data represent average of RISP BM-WT (n=7 mice) or RISP BM-KO (n=8 mice) ± SEM. (c and d) Cell number of indicated populations in adult BM of RISP BM-WT or RISP BM-KO mice 9 days after Poly (I:C) treatment. Data represent average of RISP BM-WT (n=10 mice) or RISP BM-KO (n=14 mice) ± SEM. (e and f) Percent of BrdU (e) or AnnexinV (f) positive cells in indicated populations in adult RISP BM-WT or RISP BM-KO mice 6 days after Poly (I:C) treatment. Data represents the average of RISP BM-WT (n=10 mice) or RISP BM-KO (n=9 mice) ± SEM. (g and h) Percent of BrdU (e) or AnnexinV (f) positive cells in indicated populations in adult RISP BM-WT or RISP BM-KO mice 9 days after Poly (I:C) treatment. Data represents the average of RISP BM-WT (n=8 mice) or RISP BM-KO (n=9 mice) ± SEM. (i) Median fluorescence intensity of pH2AX in indicated cell population in RISP BM-KO relative to RISP BM-WT mice. Data represents average RISP BM-WT (n=8 mice) or RISP BM-KO (n=8 mice) ± SEM. Data in Figure 8 are mean ± SEM. *p<0.05; **p<0.01. All p values calculated using Student's t-test.

Similar articles

Cited by

References

    1. Chandel NS, Jasper H, Ho TT, Passegue E. Metabolic regulation of stem cell function in tissue homeostasis and organismal ageing. Nature cell biology. 2016;18:823–832. - PubMed
    1. Ito K, Suda T. Metabolic requirements for the maintenance of self-renewing stem cells. Nature reviews Molecular cell biology. 2014;15:243–256. - PMC - PubMed
    1. Takubo K, et al. Regulation of Glycolysis by Pdk Functions as a Metabolic Checkpoint for Cell Cycle Quiescence in Hematopoietic Stem Cells. Cell stem cell. 2013;12:49–61. - PMC - PubMed
    1. Adelman DM, Maltepe E, Simon MC. Multilineage embryonic hematopoiesis requires hypoxic ARNT activity. Genes & development. 1999;13:2478–2483. - PMC - PubMed
    1. Simsek T, et al. The Distinct Metabolic Profile of Hematopoietic Stem Cells Reflects Their Location in a Hypoxic Niche. Cell stem cell. 2010;7:380–390. - PMC - PubMed

Publication types

MeSH terms