. 2017 May 15;13(5):e1006332.
doi: 10.1371/journal.ppat.1006332. eCollection 2017 May.

Structure of Ca2+-binding protein-6 from Entamoeba histolytica and its involvement in trophozoite proliferation regulation

Affiliations

Structure of Ca2+-binding protein-6 from Entamoeba histolytica and its involvement in trophozoite proliferation regulation

Deepshikha Verma et al. PLoS Pathog. .

Abstract

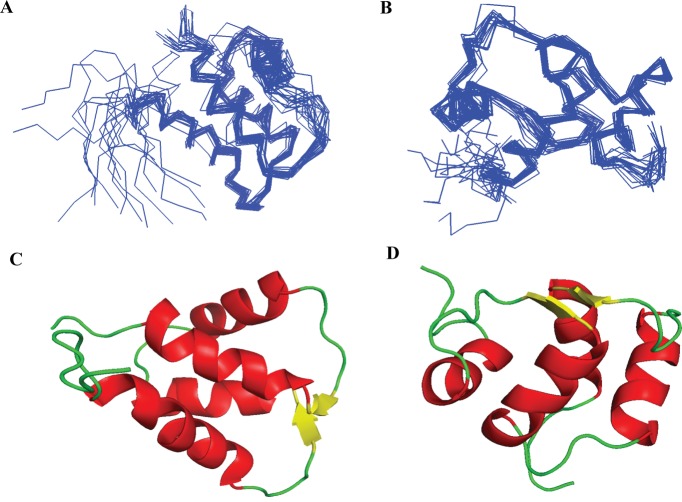
Cell cycle of Entamoeba histolytica, the etiological agent of amoebiasis, follows a novel pathway, which includes nuclear division without the nuclear membrane disassembly. We report a nuclear localized Ca2+-binding protein from E. histolytica (abbreviated hereafter as EhCaBP6), which is associated with microtubules. We determined the 3D solution NMR structure of EhCaBP6, and identified one unusual, one canonical and two non-canonical cryptic EF-hand motifs. The cryptic EF-II and EF-IV pair with the Ca2+-binding EF-I and EF-III, respectively, to form a two-domain structure similar to Calmodulin and Centrin proteins. Downregulation of EhCaBP6 affects cell proliferation by causing delays in transition from G1 to S phase, and inhibition of DNA synthesis and cytokinesis. We also demonstrate that EhCaBP6 modulates microtubule dynamics by increasing the rate of tubulin polymerization. Our results, including structural inferences, suggest that EhCaBP6 is an unusual CaBP involved in regulating cell proliferation in E. histolytica similar to nuclear Calmodulin.


Conflict of interest statement

The authors have declared that no competing interests exist.

Figures

Fig 1
Fig 1
An ensemble of 20 superimposed minimum energy NMR derived conformers of (A) N-terminal and (B) C-terminal domains of [Ca2+]2-EhCaBP6. A representative NMR derived solution structure of (C) N-terminal and (D) C-terminal domains of [Ca2+]2-EhCaBP6 having the least residual target function value among the 20 conformers generated using CYANA.
Fig 2
Fig 2. EhCaBP6 co-localizes with microtubules in mitotic structures.
(A) EhCaBP6 was observed as intense dot like structure within the nucleus (I), as radial arrays (II), as spindle fibers connecting the dividing nucleus (III) and as an intracellular bridge between the dividing cells (IV). Eh β–tubulin co-localizes with EhCaBP6 in all these structures. EhCaBP6 was stained with Alexa Flour 555 (red) while Ehβ–tubulin was stained with Alexa Flour 488 (green). (B) Statistical analysis of co-localization of EhCaBP6 and Eh β–tubulin using Pearson’s correlation coefficient.
Fig 3
Fig 3. EhCaBP6 interacts with microtubules and not with monomers of β–tubulin.
Microtubule co-sedimentation assay was performed using EhCaBP6 and β–tubulin in the presence and the absence of 1 mM GTP and 20 μM Taxol. (A) EhCaBP6 was observed in the pellet fraction along with β–tubulin, thus suggesting in vitro interaction between the two proteins. (B) Co-sedimentation assay in the absence of 1 mM GTP shows no interaction.
Fig 4
Fig 4. EhCaBP6 modulates microtubule dynamics in a dose dependent manner.
(A) The tubulin polymerization assay was performed with porcine tubulin at a final concentration of 5 μM in the presence of varying concentration of EhCaBP6. EhCaBP6 efficiently enhanced rate of polymerization subsequently affecting the total amount of polymerized microtubules. The light scattering experiment was repeated thrice in triplicates and the representation is an average of three independent run. (B) Image of the plate post tubulin polymerization light scattering experiment showing gradual increase in turbidity with increase in EhCaBP6 concentration as compared to Buffer alone, EhCaBP6 alone or Tubulin alone. (C) Densitometry analysis of the turbidity using AlphaEaseFc software. The reading was exported and plot in Microsoft Excel. The average value of three independent experiments has been represented graphically.
Fig 5
Fig 5. EhCaBP6 downregulation affects cell proliferation and DNA synthesis.
(A) Schematic representation of Tetracycline induced Tet-O-CAT vector used for generation of sense and antisense cell lines of EhCaBP6. (B) Analysis of in-vivo expression of EhCaBP6 in sense cell line upon induction with varying concentration of tetracycline by Western blot assay. The lower panel represents densitometry analysis of the protein bands obtained from Western blots. (C) Analysis of in-vivo expression of EhCaBP6 in anti-sense cell lines upon varying concentration of tetracycline and densitometric analysis of bands from western blots using AlphaEaseFC software. (D) Growth kinetics of various cell lines over a period of 72 h. Equal number of cells were inoculated and allowed to grow. The cells were harvested at indicated time points, resuspended in PBS and counted in a cell counter. (E) Cell viability during the growth kinetics assay after mixing with 0.4% Trypan blue. (F) H3 –Thymidine incorporation assay and (G) Cell viability assay studied along a period of 72 h using Trypan blue.
Fig 6
Fig 6. EhCaBP6 perturbs G1 to S phase transition during cell division cycle in E. histolytica.
(A) FACS analysis of cell population during cell division cycle in tetracycline induced vector control (TOC), Sense EhCaBP6 and Antisense EhCaBP6 cell line. (B) Histograms depicting cell populations obtained using MODFIT software. Each of these experiments was performed thrice and each plot is an average of three independent data sets.
Fig 7
Fig 7. Ehβ-tubulin co-localizes with EhCaBP6 at nuclear periphery in EhCaBP6 antisense cell line.
(A) Immunofluorescence analysis of cell population observed in anti-sense EhCaBP6 culture. (B) Quantitative analysis of the various cell populations obtained where (I) Cells having EhCaBP6 in nuclear periphery. (II) Cells with reduced expression of EhCaBP6 and (III) cells with EhCaBP6 expression comparable to normal cells. (C) Immunostaining showing peripheral co-localization of Eh-β tubulin (red) and EhCaBP6 in the nucleus (green) of the EhCaBP6 downregulated cell line. Amoebic cells containing antisense construct were serum synchronized for 24 h followed by serum replenishment and induction with 30 μg/ml of tetracycline. The cells were then fixed and immunostained with specific antibody as indicated. Alexa-488 (green) or Alexa-555 (red) conjugated secondary antibodies were used for visualization. Nucleus was stained with DAPI (blue). (D) Intensity profile of Eh-β tubulin and EhCaBP6 along the nucleus as indicated by red line to visualize co-localization of these molecules in the nuclear periphery. (E) Statistical analysis of co-localization of EhCaBP6 and Eh β-tubulin along nuclear periphery using Pearson’s correlation coefficient.
Fig 8
Fig 8. Eh-β tubulin does not co-localize with EhCaBP6 at truncated nuclear structures or intra-nuclear bridge.
(A) EhCaBP6 forms truncated intra-nuclear structures within the nucleus in EhCaBP6 downregulated cell line. However, Eh-β tubulin does not line these truncated structures or intra-nuclear bridge as seen from immunostaining data. Amoebic cells containing Antisense construct were serum synchronized for 24 h followed by serum replenishment and induction with 30 μg/ml tetracycline. The cells were then fixed and immunostained with specific antibody as indicated. Alexa-488 (green) or Alexa-555 (red) conjugated secondary antibodies were used for visualization. Nucleus was stained with DAPI (blue). (B) Intensity profile of Eh-β tubulin and EhCaBP6 along the truncated intranuclear structures as indicated by red arrow to visualize co-localization of these molecules. (C) Statistical analysis of colocalization of EhCaBP6 and Ehβ-tubulin along truncated nuclear structures as determined by Pearson’s correlation coefficient. (D) Quantitative analysis of multinucleation in various cell lines under study. The amoebic cells containing the constructs were serum synchronized for 24 h followed by replenishment with complete media and induction with 30 μg/ml tetracycline. The cells were harvested at indicated time points and stained with DAPI to visualize and count the multinucleated cells. The experiment was repeated thrice and 20 fields were analyzed for each experiment.

Similar articles

Cited by

References

    1. Kahl CR, Means AR (2003) Regulation of cell cycle progression by Calcium/Calmodulin-dependent pathways. Endocr Rev. 24: 719–736. doi: 10.1210/er.2003-0008 - DOI - PubMed
    1. Choi J, Husain M (2006) Calmodulin-mediated cell cycle regulation: new mechanisms for old observation. Cell Cycle. 5: 2183–2186. doi: 10.4161/cc.5.19.3265 - DOI - PubMed
    1. Short AD, Bian J, Ghosh TK, Waldron RT, Rybak SL, Gill DL (1993) Intracellular Ca2+ pool content is linked to control of cell growth. Proc Natl Acad Sci U S A. 90: 4986–90. - PMC - PubMed
    1. Santella L (1998) The role of calcium in the cell cycle: facts and hypotheses. Biochem Biophys Res Commun. 244: 317–24. doi: 10.1006/bbrc.1998.8086 - DOI - PubMed
    1. Whitaker M, Patel R (1990) Calcium and cell cycle control. Development. 108: 525–542. - PubMed

MeSH terms