. 2017 May 15;18(1):381.
doi: 10.1186/s12864-017-3750-2.

In silico pathway analysis and tissue specific cis-eQTL for colorectal cancer GWAS risk variants

Affiliations

In silico pathway analysis and tissue specific cis-eQTL for colorectal cancer GWAS risk variants

Lenora W M Loo et al. BMC Genomics. .

Abstract

Background: Genome-wide association studies have identified 55 genetic variants associated with colorectal cancer risk to date. However, potential causal genes and pathways regulated by these risk variants remain to be characterized. Therefore, we performed gene ontology enrichment and pathway analyses to determine if there was an enrichment of genes in proximity to the colorectal cancer risk variants that could further elucidate the probable causal genes and pathways involved in colorectal cancer biology.

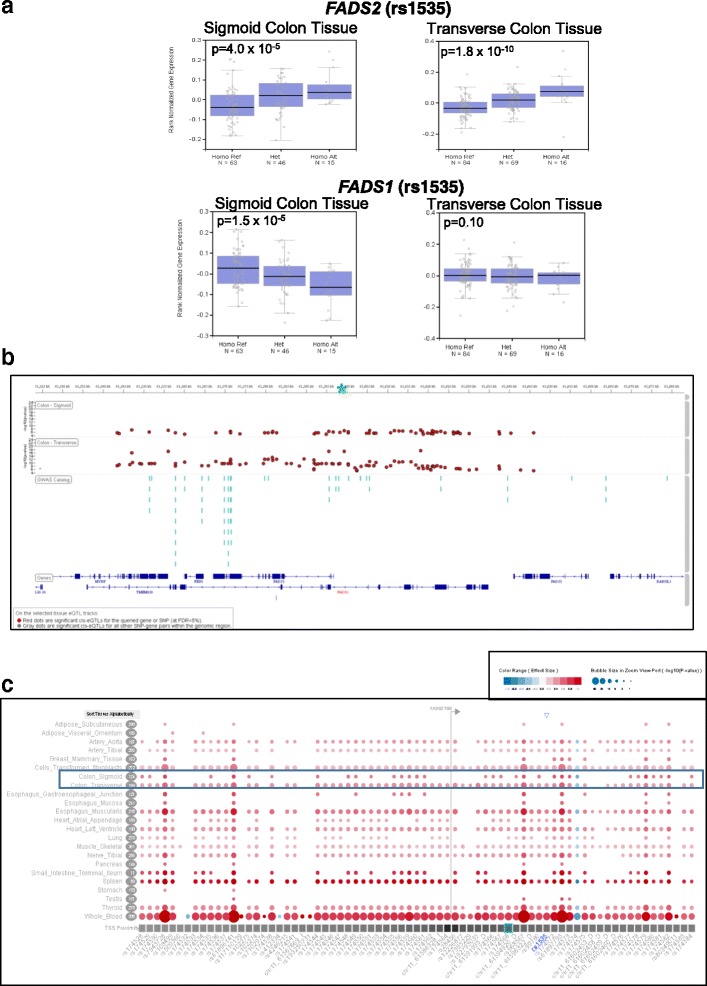
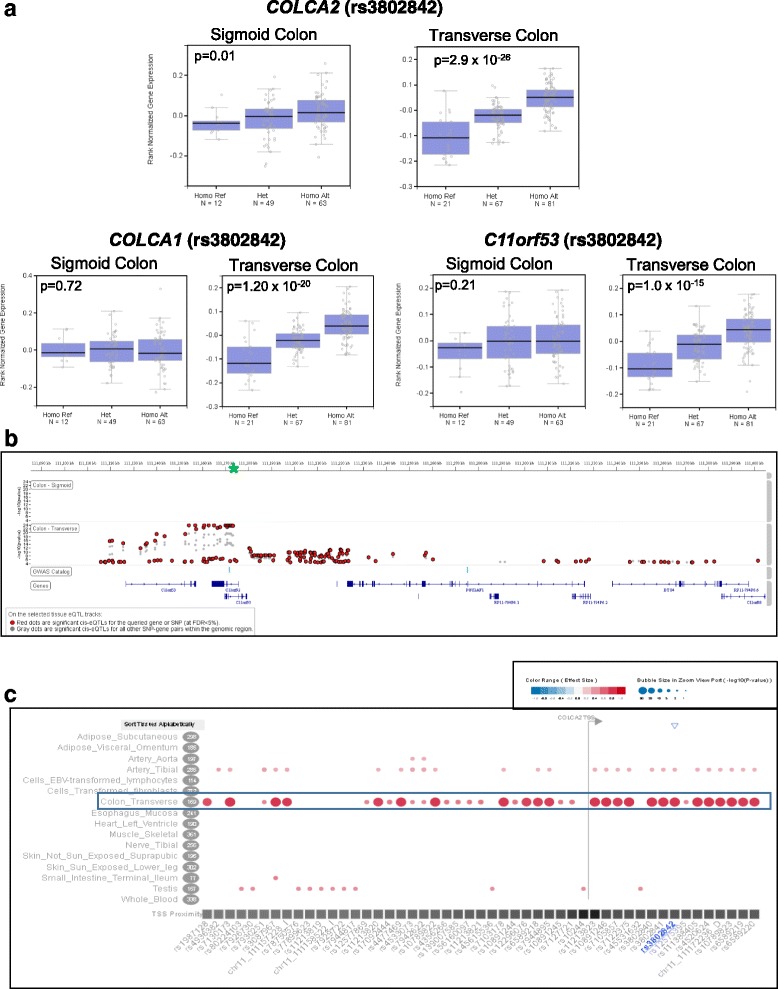
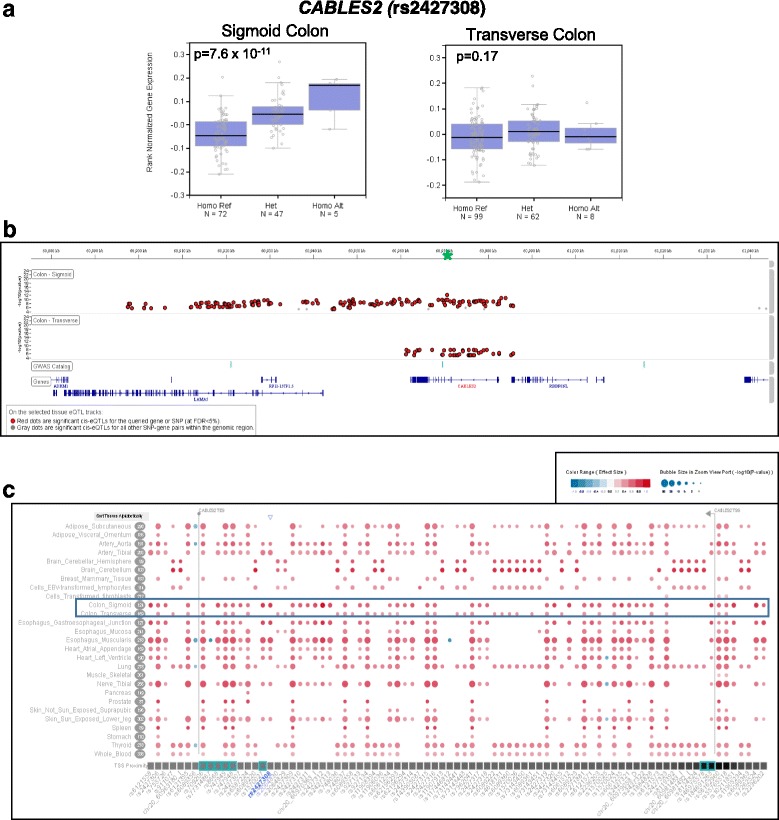
Results: For the 65 unique genes that either contained, or were immediately neighboring up- and downstream, of these variants there was a significant enrichment for the KEGG pathway, Pathways in Cancer (p-value = 2.67 × 10⁻⁵) and an enrichment for multiple biological processes (FDR < 0.05), such as cell junction organization, tissue morphogenesis, regulation of SMAD protein phosphorylation, and odontogenesis identified through Gene Ontology analysis. To identify potential causal genes, we conducted a cis-expression quantitative trait loci (cis-eQTL) analysis using gene expression and genotype data from the Genotype-Tissue Expression (GTEx) Project portal in normal sigmoid (n = 124) and transverse (n = 169) colon tissue. In addition, we also did a cis-eQTL analysis on colorectal tumor tissue (n = 147) from The Cancer Genome Atlas (TCGA). We identified two risk alleles that were significant cis-eQTLs for FADS2 (rs1535) and COLCA1 and 2 (rs3802842) genes in the normal transverse colon tissue and two risk alleles that were significant cis-eQTLs for the CABLES2 (rs2427308) and LIPG (rs7229639) genes in the normal sigmoid colon tissue, but not tumor tissue.

Conclusions: Our data reaffirm the potential to identify an enrichment for biological processes and candidate causal genes based on expression profiles correlated with genetic risk alleles of colorectal cancer, however, the identification of these significant cis-eQTLs is context and tissue specific.

Keywords: Colorectal cancer; Gene expression; Risk variant; eQTL.


Figures

Fig. 1
Fig. 1
eQTL for rs1535 in Normal Sigmoid and Transverse Colon Tissue. a Box plots of gene expression profiles for FADS2 and FADS1 expression by genotype in normal sigmoid and transverse colon tissue. Reference Allele (risk allele) = A; Alternate Allele = G. b cis-eQTLs (+/− 1 Mb window) for FADS2 in normal sigmoid and transverse colon tissue. rs1535 is indicated by the green asterisk (*). c cis-eQTLs for FADS2 in 23 different tissue types. Bubble size represents –log10(p-value) and color and shading of the bubble represents effect size of the cis-eQTL
Fig. 2
Fig. 2
eQTL for rs3802842 in Normal Sigmoid and Transverse Colon Tissue. a Box plots of gene expression profiles for COLCA2, COLCA1, and c11orf53, expression by genotype in normal sigmoid and transverse colon tissue. Reference Allele (risk allele) = C; Alternate Allele = A. b cis-eQTLs (+/− 1 Mb window) for COLCA2 in normal sigmoid and transverse colon tissue. rs3802842 is indicated by the green asterisk (*). c cis-eQTLs for COLCA2 in 16 different tissue types. Bubble size represents –log10 (p-value) and color and shading of the bubble represents effect size of the cis-eQTL
Fig. 3
Fig. 3
eQTL for rs2427308 in Normal Sigmoid and Transverse Colon Tissue. a Box plots of gene expression profiles for CABLES2 expression by genotype in normal sigmoid and transverse colon tissue. Reference Allele (risk allele) = C; Alternate Allele = T. b cis-eQTLs (+/− 1 Mb window) for CABLES2 in normal sigmoid and transverse colon tissue. rs2427308 is indicated by the green asterisk (*). c cis-eQTLs for CABLES2 in 27 different tissue types. Bubble size represents –log10 (p-value) and color and shading of the bubble represents effect size of the cis-eQTL

References

    1. Welter D, MacArthur J, Morales J, Burdett T, Hall P, Junkins H, Klemm A, Flicek P, Manolio T, Hindorff L, et al. The NHGRI GWAS Catalog, a curated resource of SNP-trait associations. Nucleic Acids Res. 2014;42(Database issue):D1001–1006. doi: 10.1093/nar/gkt1229. - DOI - PMC - PubMed
    1. A Catalog of Published Genome-Wide Association Studies [https://www.ebi.ac.uk/gwas/home]. Accessed April 2016.
    1. Consortium G. The Genotype-Tissue Expression (GTEx) project. Nat Genet. 2013;45(6):580–585. doi: 10.1038/ng.2653. - DOI - PMC - PubMed
    1. Rosenbloom KR, Sloan CA, Malladi VS, Dreszer TR, Learned K, Kirkup VM, Wong MC, Maddren M, Fang R, Heitner SG, et al. ENCODE data in the UCSC Genome Browser: year 5 update. Nucleic Acids Res. 2013;41(Database issue):D56–63. doi: 10.1093/nar/gks1172. - DOI - PMC - PubMed
    1. The-Cancer-Genome-Atlas-Network Comprehensive molecular characterization of human colon and rectal cancer. Nature. 2012;487(7407):330–337. doi: 10.1038/nature11252. - DOI - PMC - PubMed