. 2017 May 16;18(1):86.
doi: 10.1186/s13059-017-1216-0.

Quantifying the mapping precision of genome-wide association studies using whole-genome sequencing data

Affiliations

Quantifying the mapping precision of genome-wide association studies using whole-genome sequencing data

Yang Wu et al. Genome Biol. .

Abstract

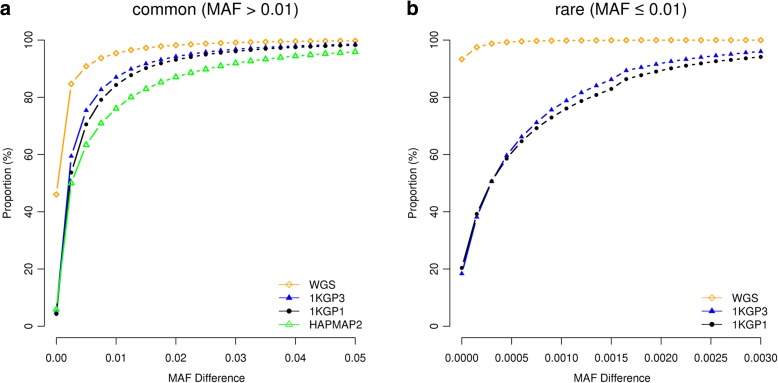
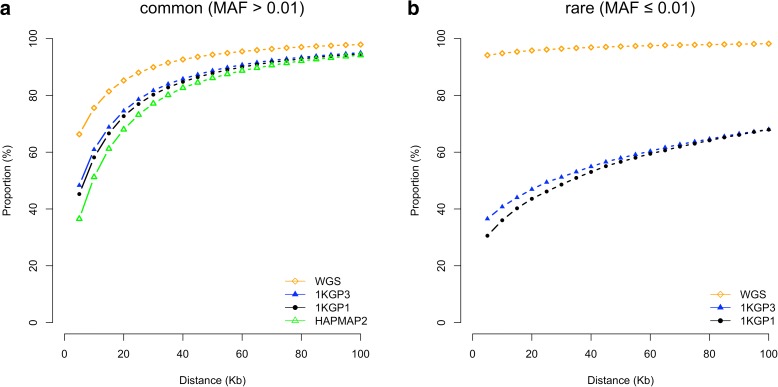
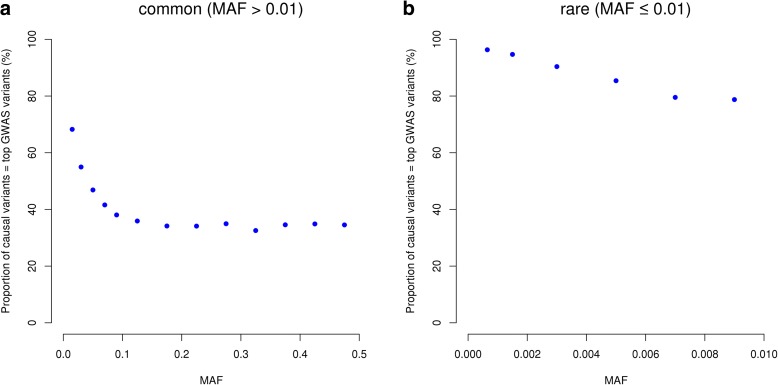
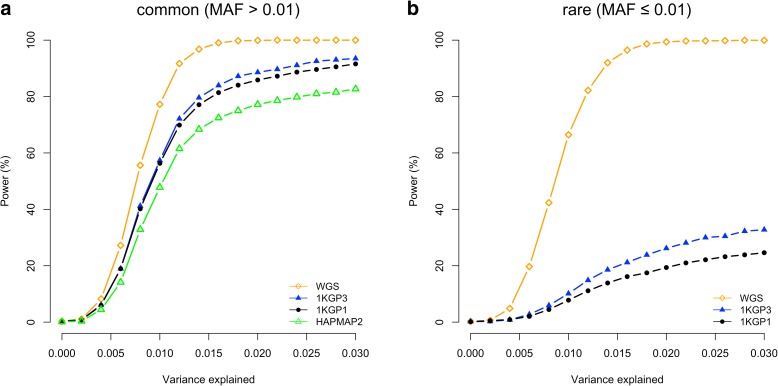
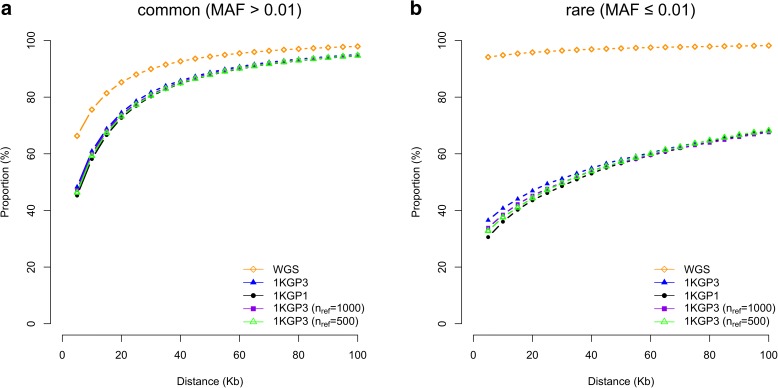
Background: Understanding the mapping precision of genome-wide association studies (GWAS), that is the physical distances between the top associated single-nucleotide polymorphisms (SNPs) and the causal variants, is essential to design fine-mapping experiments for complex traits and diseases.

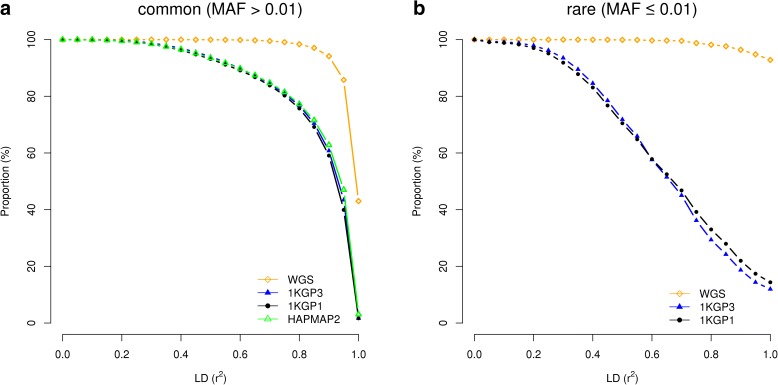
Results: Using simulations based on whole-genome sequencing (WGS) data from 3642 unrelated individuals of European descent, we show that the association signals at rare causal variants (minor allele frequency ≤ 0.01) are very unlikely to be mapped to common variants in GWAS using either WGS data or imputed data and vice versa. We predict that at least 80% of the common variants identified from published GWAS using imputed data are within 33.5 Kbp of the causal variants, a resolution that is comparable with that using WGS data. Mapping precision at these loci will improve with increasing sample sizes of GWAS in the future. For rare variants, the mapping precision of GWAS using WGS data is extremely high, suggesting WGS is an efficient strategy to detect and fine-map rare variants simultaneously. We further assess the mapping precision by linkage disequilibrium between GWAS hits and causal variants and develop an online tool (gwasMP) to query our results with different thresholds of physical distance and/or linkage disequilibrium ( http://cnsgenomics.com/shiny/gwasMP ).

Conclusions: Our findings provide a benchmark to inform future design and development of fine-mapping experiments and technologies to pinpoint the causal variants at GWAS loci.

Keywords: False positive rate; Genome-wide association studies; Imputation; Mapping precision; Whole genome sequencing.


Figures

Fig. 1
Fig. 1
Differences in MAF between GWAS hits and causal variants for different genotyping strategies. Results are from 50,000 simulations based on the UK10K-WGS data for common (a) and rare (b) causal variants, respectively. Shown on the y-axis is the proportion of causal variants that were mapped to variants with MAF differences smaller than a value specified on the x-axis
Fig. 2
Fig. 2
Mapping precision of GWAS based on different genotyping strategies. Results are from 50,000 simulations for causal common (a) and rare (b) variants, respectively, based on the UK10K-WGS data. Shown on the y-axis is the proportion of causal variants that were mapped to variants within a certain distance as specified on the x-axis
Fig. 3
Fig. 3
Proportion of causal variants that are the top associated variants in GWAS. Shown are the mean values in MAF bins from 50,000 simulations based on the UK10K-WGS data for common (a) and rare (b) variants, respectively
Fig. 4
Fig. 4
Statistical power of GWAS based on different genotyping strategies. Power is calculated as the proportion of simulations with a least a variant at P < 5e-8. Shown are the results from 5000 simulations for common (a) and rare (b) variants, respectively, at each heritability level
Fig. 5
Fig. 5
Mapping precision of GWAS based on imputations with different sample sizes of the reference panel. Shown are results from 50,000 simulations for common (a) and rare (b) variants, respectively. 1KGP3 (n ref = 1000) and 1KGP3 (n ref = 500): SNP array data imputed to a random subset of 1000 and 500 individuals randomly sampled from 1KGP3, respectively
Fig. 6
Fig. 6
Mapping precision of GWAS as measured by the squared LD correlations between causal variants and GWAS top SNPs based on different genotyping strategies. Results are from 50,000 simulations for causal common (a) and rare (b) variants, respectively, based on the UK10K-WGS data. Shown on the y-axis is the proportion of causal variants that were mapped to variants with LD r 2 smaller than a certain threshold as specified on the x-axis

References

    1. Welter D, MacArthur J, Morales J, Burdett T, Hall P, Junkins H, et al. The NHGRI GWAS Catalog, a curated resource of SNP-trait associations. Nucleic Acids Res. 2014;42:1001–6. doi: 10.1093/nar/gkt1229. - DOI - PMC - PubMed
    1. Smemo S, Tena JJ, Kim KH, Gamazon ER, Sakabe NJ, Gomez-Marin C, et al. Obesity-associated variants within FTO form long-range functional connections with IRX3. Nature. 2014;507:371–5. doi: 10.1038/nature13138. - DOI - PMC - PubMed
    1. Claussnitzer M, Dankel SN, Kim K-H, Quon G, Meuleman W, Haugen C, et al. FTO obesity variant circuitry and adipocyte browning in humans. N Engl J Med. 2015;373:895–907. doi: 10.1056/NEJMoa1502214. - DOI - PMC - PubMed
    1. Sekar A, Bialas AR, de Rivera H, Davis A, Hammond TR, Kamitaki N, et al. Schizophrenia risk from complex variation of complement component 4. Nature. 2016;530:177–83. doi: 10.1038/nature16549. - DOI - PMC - PubMed
    1. Musunuru K, Strong A, Frank-Kamenetsky M, Lee NE, Ahfeldt T, Sachs KV, et al. From noncoding variant to phenotype via SORT1 at the 1p13 cholesterol locus. Nature. 2010;466:714–9. doi: 10.1038/nature09266. - DOI - PMC - PubMed

LinkOut - more resources