. 2017 May 30;114(22):5607-5611.
doi: 10.1073/pnas.1701562114. Epub 2017 May 15.

Highly active catalyst derived from a 3D foam of Fe(PO3)2/Ni2P for extremely efficient water oxidation

Affiliations

Highly active catalyst derived from a 3D foam of Fe(PO3)2/Ni2P for extremely efficient water oxidation

Haiqing Zhou et al. Proc Natl Acad Sci U S A. .

Abstract

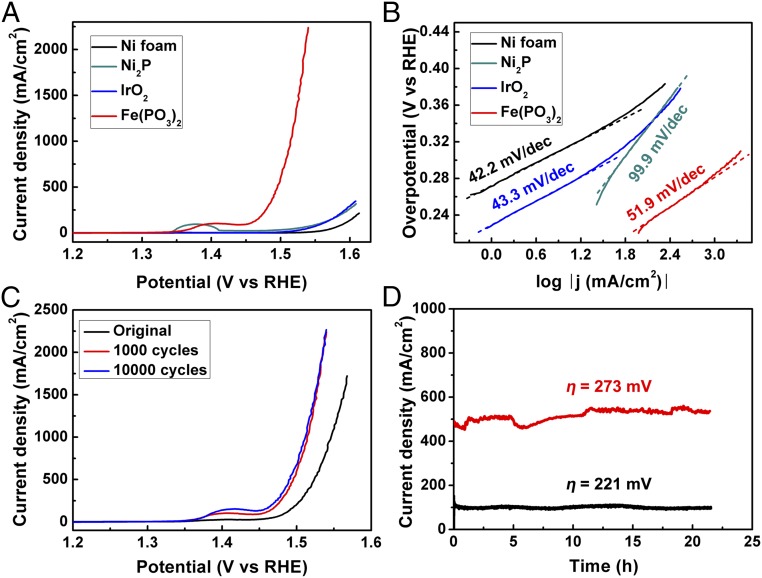
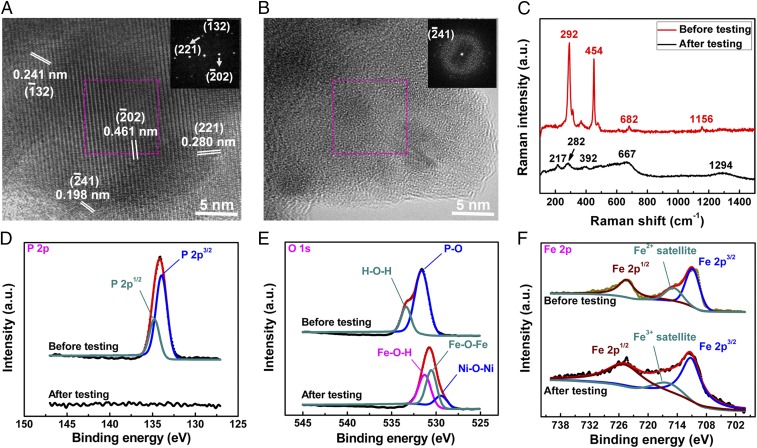
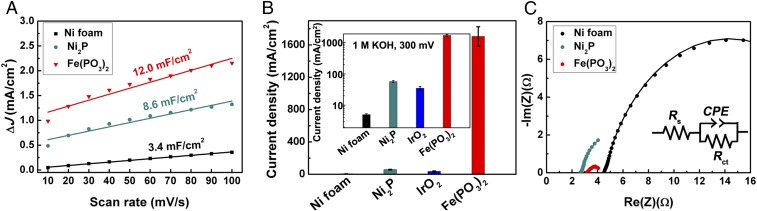
Commercial hydrogen production by electrocatalytic water splitting will benefit from the realization of more efficient and less expensive catalysts compared with noble metal catalysts, especially for the oxygen evolution reaction, which requires a current density of 500 mA/cm2 at an overpotential below 300 mV with long-term stability. Here we report a robust oxygen-evolving electrocatalyst consisting of ferrous metaphosphate on self-supported conductive nickel foam that is commercially available in large scale. We find that this catalyst, which may be associated with the in situ generated nickel-iron oxide/hydroxide and iron oxyhydroxide catalysts at the surface, yields current densities of 10 mA/cm2 at an overpotential of 177 mV, 500 mA/cm2 at only 265 mV, and 1,705 mA/cm2 at 300 mV, with high durability in alkaline electrolyte of 1 M KOH even after 10,000 cycles, representing activity enhancement by a factor of 49 in boosting water oxidation at 300 mV relative to the state-of-the-art IrO2 catalyst.

Keywords: commercial utilization; electrocatalytic water splitting; ferrous metaphosphate; iron; oxygen evolution reaction.


Conflict of interest statement

The authors declare no conflict of interest.

Figures

Fig. 1.
Fig. 1.
Electrocatalytic water oxidation activity. (A) Polarization curves recorded on different electrodes with a three-electrode configuration in 1 M KOH electrolyte. (B) The relevant Tafel plots of the catalysts studied in A. (C) Polarization curves of the Fe(PO3)2 catalyst at its initial state and after 1,000 and 10,000 cycles. (D) Chronoamperometric measurements of the OER at high current densities of 100 and 500 mA/cm2 for the Fe(PO3)2 electrode.
Fig. 2.
Fig. 2.
Structural characterization. (A and B) High-resolution TEM images and FFT patterns (Insets) of the Fe(PO3)2 catalyst: (A) As prepared, displaying good crystallization, and (B) post-OER (after 10,000 cycles), mainly in an amorphous state. (C) Raman spectra of as-prepared and post-OER (after 10,000 cycles) catalysts. (D) XPS spectra of P 2p binding energies before and after OER tests (after 10,000 cycles). The P 2p peak in the original samples can be deconvoluted into two components, 2p3/2 at 133.9 eV and 2p1/2 at 134.7 eV, confirming the formation of PO3 compounds, and no P signal is detected in post-OER samples, suggesting structure changes on the catalyst surface. (E) XPS spectra of O 1s binding energies before and after OER tests (after 10,000 cycles). The original samples have two components of 531.8 eV for PO3 and 533.4 eV for adsorbed H2O, and post-OER samples show O 1s core-level features consisting of FeOOH and nickel oxide, meaning that amorphous FeOOH is probably the dominant active site for water oxidation. (F) XPS spectra of Fe 2p3/2 and 2p1/2 binding energies before and after OER tests (after 10,000 cycles). It is apparent that the valence state of the Fe element is +2 for the as-synthesized samples, and it is gradually converted to +3 at the surface during water oxidation. The black and red curves in DF are the original and fitted data, respectively. a.u., arbitrary unit.
Fig. 3.
Fig. 3.
Double-layer capacitance (Cdl) and EIS measurements. (A) Capacitive J (= JaJc) versus the scan rates for the Fe(PO3)2 electrode compared with Ni2P and Ni foam. (B) Comparison of the current density of the Fe(PO3)2 electrode with those of the benchmark IrO2, Ni2P, and Ni foam at 300 mV. The Inset is the plot of the current density in logarithmic scale. The error bars represent the range of the current density values from three independent measurements. (C) Nyquist plots of different oxygen evolution electrodes at the applied 300 mV overpotential. Inset is simplified Randle circuit model. All measurements were performed in 1 M KOH electrolyte.

References

    1. Lewis NS, Nocera DG. Powering the planet: Chemical challenges in solar energy utilization. Proc Natl Acad Sci USA. 2006;103:15729–15735. - PMC - PubMed
    1. Dresselhaus MS, Thomas IL. Alternative energy technologies. Nature. 2001;414:332–337. - PubMed
    1. Gray HB. Powering the planet with solar fuel. Nat Chem. 2009;1:7. - PubMed
    1. Walter MG, et al. Solar water splitting cells. Chem Rev. 2010;110:6446–6473. - PubMed
    1. Gao S, et al. Partially oxidized atomic cobalt layers for carbon dioxide electroreduction to liquid fuel. Nature. 2016;529:68–71. - PubMed

Publication types