Review
. 2017 Jun 28;375(2096):20160283.
doi: 10.1098/rsta.2016.0283.

Understanding principles of integration and segregation using whole-brain computational connectomics: implications for neuropsychiatric disorders

Affiliations
Review

Understanding principles of integration and segregation using whole-brain computational connectomics: implications for neuropsychiatric disorders

Louis-David Lord et al. Philos Trans A Math Phys Eng Sci. .

Abstract

To survive in an ever-changing environment, the brain must seamlessly integrate a rich stream of incoming information into coherent internal representations that can then be used to efficiently plan for action. The brain must, however, balance its ability to integrate information from various sources with a complementary capacity to segregate information into modules which perform specialized computations in local circuits. Importantly, evidence suggests that imbalances in the brain's ability to bind together and/or segregate information over both space and time is a common feature of several neuropsychiatric disorders. Most studies have, however, until recently strictly attempted to characterize the principles of integration and segregation in static (i.e. time-invariant) representations of human brain networks, hence disregarding the complex spatio-temporal nature of these processes. In the present Review, we describe how the emerging discipline of whole-brain computational connectomics may be used to study the causal mechanisms of the integration and segregation of information on behaviourally relevant timescales. We emphasize how novel methods from network science and whole-brain computational modelling can expand beyond traditional neuroimaging paradigms and help to uncover the neurobiological determinants of the abnormal integration and segregation of information in neuropsychiatric disorders.This article is part of the themed issue 'Mathematical methods in medicine: neuroscience, cardiology and pathology'.

Keywords: brain connectivity; computational modelling; integration and segregation; network analysis; neuropsychiatric disorders.


Conflict of interest statement

We declare we have no competing interests.

Figures
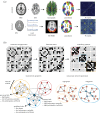
Figure 1.
Figure 1.
Investigating human brain connectivity with neuroimaging and graph theory. (a) To create a SC network, MRI and DTI data are required, on which tractography analysis is then performed to uncover the presence (or absence) of structural links between region pairs in the chosen parcellation scheme. These interactions are ultimately summarized in the SC matrix. To create a FC matrix, brain activity is measured; in this case using resting-state (RS) fMRI to record BOLD time courses in each voxel in the brain. This is then combined with a parcellation scheme to recreate the regional time courses for each of the regions in the parcellation. The FC matrix is then typically created from correlating inter-regional timecourses. (b) The connection strength matrices introduced in (a) may then be thresholded to derive a binarized representation of the connections in the system. This binarized network representation can in turn be used to study either the organization of brain networks at the mesoscopic level (i.e. community structure) or at the local level (i.e. topological properties of individual network nodes), both of which can reveal useful insights into the network organization.
Figure 2.
Figure 2.
Brain structural and FC changes in neuropsychiatric disorders. (a)(i) In SZ, reduced resting state functional and structural connectivity have been reported in subnetworks of interconnected regions [20]. (ii) Significant between-group differences in the modularity architecture of the brain have been found in resting-state fMRI data of childhood-onset SZ patients relative to healthy controls [21]. (b) In bipolar I disorder, interhemispheric anatomical connections show marked reductions in patients relative to controls, while intrahemispheric structural connectivity is comparatively unchanged [22]. (c) Whole-brain resting-state FC analysis of subjects with ASD reveals both increases (i) and decreases (ii) in FC relative to healthy controls [23]. (d) Resting-state fMRI connectivity data show that Parkinson's disease patients show reduced FC within the basal ganglia network in a wide range of regions. This same study showed that the FC deficits can be improved with medication [24]. Panel (c) adapted from Di Martino et al. [23].
Figure 3.
Figure 3.
Overview of whole-brain computational modelling. (a) Whole-brain computational modelling of functional neuroimaging data uses empirical SC data obtained from DTI tractography, and FC data on the corresponding anatomical parcellation. A whole-brain model can be constructed by coupling the simulated local node dynamics (in this exemplar case, a simple mean-field model) according to the SC. The modelled activity is thus constrained by both the strength of each anatomical coupling and the physical distance between brain regions, and further scaled according to a global conductance parameter [47,48]. (b) A whole-brain computational model previously tuned to match the empirical data may be subjected to extrinsic perturbations, in silico. This is done by injecting the modelled dynamics with a random set of Gaussian inputs. The amount of integration in the system can be calculated after each perturbation: perturbational integration is defined by considering the length of the largest connected component of the binarized network as an estimate of the amount of integration in the system after each perturbation. Similarly, perturbational segregation is calculated through the entropy of the set of evoked patterns assuming a Gaussian distribution of stimulations [40]. Panel (a) adapted from Hellyer et al. [49].
Figure 4.
Figure 4.
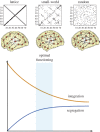
Influences of brain structural connectivity on integration and segregation. To investigate the effect of different degrees of small-world architecture of the structural connectome on the integration and segregation of neural activity in silico, an otherwise realistic whole-brain model can be outfitted with different artificial structural connectomes. Simulations whole-brain dynamics on the different structural networks demonstrated that, as the structural connectivity gradually changes from an ordered lattice to a disordered graph, perturbational integration decreases because randomness shortens the length of the largest component in the network, while perturbational segregation follows the opposite trend because randomness increases the capability to distinguish between two different external inputs. The optimal balance between functional integration and segregation is obtained at an intermediate (i.e. small-world) structural connectivity between order and randomness [40].
Figure 5.
Figure 5.
Influences of the E/I balance on integration and segregation. (a) To allow for healthy brain function, excitation (red) and inhibition (blue) must be tightly balanced over both space and time. (b) Reciprocal interactions between excitatory pyramidal cells and inhibitory interneurons at the level of cortical microcircuits maintain the E/I ratio within a narrow range capable of generating high-frequency neural oscillations [52]. (c) Local field potential (LFP) recordings experimentally recorded under conditions of suppressed excitation (left), suppressed inhibition (right) or unperturbed E/I (middle). Population LFP events represented as binary patterns: 1 = active site; 0 = inactive. Suppressed excitation leads to a loss of integration as only the activation of isolated small network clusters is possible (bottom left). Suppressed inhibition leads to a loss of segregation and co-activation of large clusters covering nearly the entire system (bottom right), reflecting excessive integration. Balanced E/I (bottom middle) enables the co-activation of clusters of all sizes [53]. (d) Scaling up the global conductance parameter in a whole-brain computational model has a profound impact on the functional network dynamics. Whole-brain computational models have shown that the best fit between the simulated and empirical FC matrices is obtained when the system operates in a metastable synchronization state where excitation and inhibition are balanced. The measures of perturbational integration and segregation also become optimally balanced at these intermediate global conductance values [40]. Graphics for: (a) adapted from Deneve et al. [54]; (c) adapted from Shew et al. [53].
Figure 6.
Figure 6.
A dynamic Hopf computational model of brain function. (a) The recently developed Hopf whole-brain computational model is a neural mass model based on the normal form of a Hopf bifurcation that combines features of both asynchronous and oscillatory behaviour. As with earlier whole-brain models, the Hopf model is based on the empirical structural connectivity (SC) to constrain the dynamics in a biologically plausible space–time architecture. At the level of local neural masses, depending on the bifurcation parameter, the local model generates a noisy signal (i), a mixed noisy and oscillatory signal (ii) or an oscillatory signal (iii). It is at the border between noisy and oscillatory behaviour (ii) that the simulated signal achieves the best fit with the empirical data [102]. (b) Simulated neural dynamics from the Hopf model are fitted to the dynamical functional connectivity (FCD) matrix of the empirical data, which allows the model to reflect the brain's dynamical repertoire of network states, rather than merely capturing the time-averaged FC. For comparing the FCD statistics between the empirical and simulated data, the distributions of the upper triangular elements of the FCD matrices of individual subjects are compared by means of the Kolmogorov–Smirnov distance between them. The Kolmogorov–Smirnov distance quantifies the maximal difference between the cumulative distribution functions of the two samples. Graphics in panel (b) adapted from Hansen et al. [65] and Deco et al. [102].
Figure 7.
Figure 7.
Measures of spatio-temporal integration and segregation. (a) Dynamic cartographic analysis performed on empirical FC data. Each time window (top) is broadly partitioned into either an ‘integrated’ topological state or ‘segregated’ topological state using k-means clustering. The heatmaps show the mean cartographic profile of the segregated topological state (left) in which most nodes spend a high-proportion of time serving as peripheral nodes in the network topology. Conversely, the mean cartographic profile of the integrated topological state comprises a significant proportion of nodes serving as hubs between different modules over the recording interval [42]. (b) The measures of perturbational integration and segregation introduced earlier may also be extended to the time domain. For example, spatio-temporal perturbational integration, or simply ‘spatio-temporal binding’ can be used to characterize the effectiveness of the integration of distributed information across the brain over time. For each brain region, the largest component that includes a given node is calculated after each perturbation. This is repeated separately for each sliding window, and assimilating this information over all time windows then yields the spatio-temporal ‘binding score’ for a particular brain region. Experimental results indicate that this spatio-temporal binding measure is capable of capturing the functional disconnection over time during sleep, as reflected by lower regional binding scores. By contrast, the time-averaged FC matrix for the same data shows that the sleeping brain is more globally connected functionally (bottom) [102]. Panel (a) adapted from Shine et al. [42].

Similar articles

Cited by

References

    1. Bassett DS, Bullmore ET. 2009. Human brain networks in health and disease. Curr. Opin. Neurol. 22, 340 (10.1097/WCO.0b013e32832d93dd) - DOI - PMC - PubMed
    1. Fornito A, Zalesky A, Breakspear M. 2015. The connectomics of brain disorders. Nat. Rev. Neurosci. 16, 159–172. (10.1038/nrn3901) - DOI - PubMed
    1. Bullmore E, Sporns O. 2009. Complex brain networks: graph theoretical analysis of structural and functional systems. Nat. Rev. Neurosci. 10, 186–198. (10.1038/nrn2575) - DOI - PubMed
    1. Watts DJ, Strogatz SH. 1998. Collective dynamics of ‘small-world'networks. Nature 393, 440–442. (10.1038/30918) - DOI - PubMed
    1. Bassett DS, Bullmore E. 2006. Small-world brain networks. Neuroscientist 12, 512–523. (10.1177/1073858406293182) - DOI - PubMed

LinkOut - more resources