

Comparative Analysis of Non-viral Transfection Methods in Mouse Embryonic Fibroblast Cells
- PMID: 28507462
- PMCID: PMC5410126
- DOI: 10.7171/jbt.17-2802-003
Comparative Analysis of Non-viral Transfection Methods in Mouse Embryonic Fibroblast Cells
Abstract
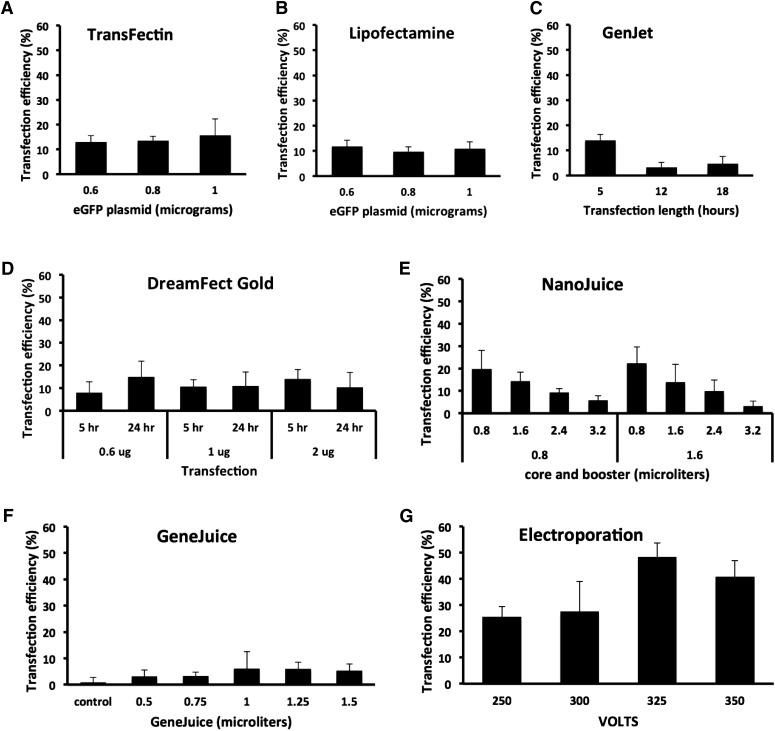
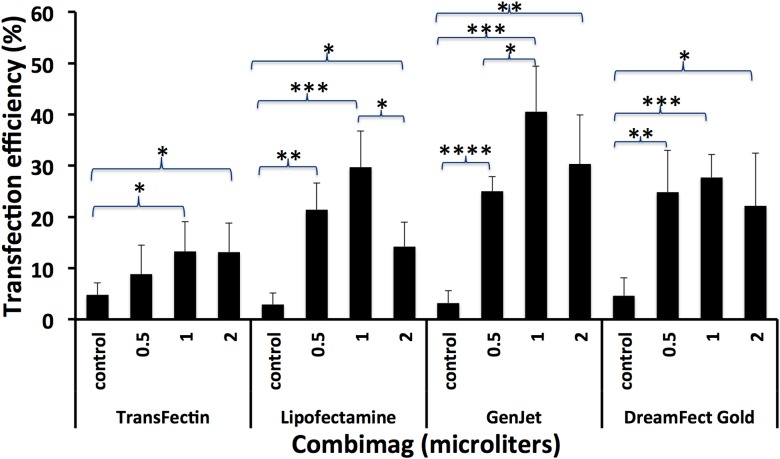
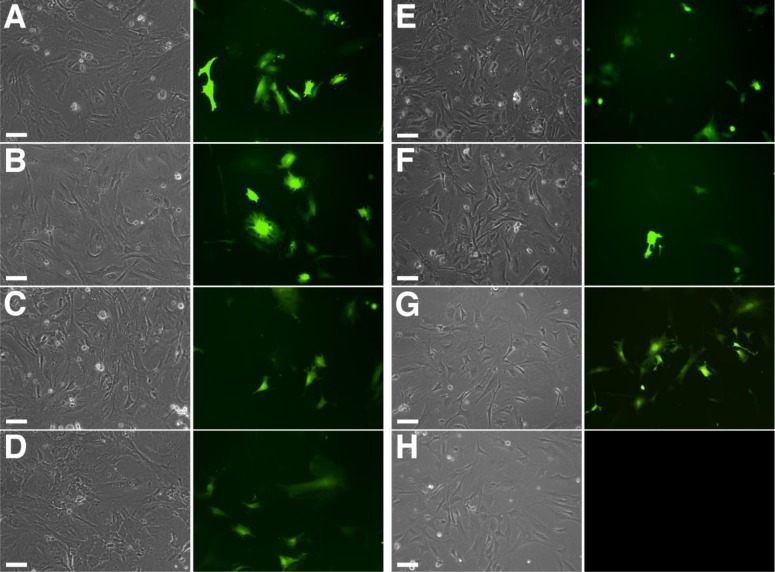
Mouse embryonic fibroblast (MEF) cells are an important in vitro model for developmental biology, disease, and reprogramming studies. However, as with other primary cells, they are challenging to transfect. Although viral gene-delivery methods achieve high gene-delivery efficiency, challenges with cell mutagenesis and safety among others have led to the use and improvement of non-viral gene-delivery methods in MEF cells. Despite the importance of gene delivery in MEF cells, there is limited comparison of method/reagent efficacy. In this study, we compared the effectiveness of different gene-delivery methods and several reagents currently available in MEF cells by introducing a plasmid containing enhanced green fluorescent protein (EGFP). We analyze transfection efficiency by EGFP fluorescence. Our results suggest that two gene-delivery methods-electroporation and magnetofection in combination with a lipid reagent, are the most efficient transfection methods in MEF cells. This study provides a foundation for the selection of transfection methods or reagents when using MEF cells.
Keywords: MEF; dendrimer; electroporation; lipid-based transfection; magnetofection.
Figures
Similar articles
-
Mouse embryonic stem cells efficiently lipofected with nuclear localization peptide result in a high yield of chimeric mice and retain germline transmission potency.Methods. 2004 Jun;33(2):113-20. doi: 10.1016/j.ymeth.2003.11.008. Methods. 2004. PMID: 15121165
-
Transfection of CCE mouse embryonic stem cells with EGFP and BDNF genes by the electroporation method.Rejuvenation Res. 2006 Spring;9(1):26-30. doi: 10.1089/rej.2006.9.26. Rejuvenation Res. 2006. PMID: 16608392
-
Enhanced nanomagnetic gene transfection of human prenatal cardiac progenitor cells and adult cardiomyocytes.PLoS One. 2013 Jul 31;8(7):e69812. doi: 10.1371/journal.pone.0069812. Print 2013. PLoS One. 2013. PMID: 23936108 Free PMC article.
-
Current standards and pitfalls associated with the transfection of primary fibroblast cells.Biotechnol Prog. 2021 Jul;37(4):e3152. doi: 10.1002/btpr.3152. Epub 2021 Apr 9. Biotechnol Prog. 2021. PMID: 33774920 Review.
-
Nucleic acid direct delivery to fibroblasts: a review of nucleofection and applications.J Biol Eng. 2022 Nov 4;16(1):30. doi: 10.1186/s13036-022-00309-5. J Biol Eng. 2022. PMID: 36329479 Free PMC article. Review.
Cited by
-
Gene-edited murine cell lines for propagation of chronic wasting disease prions.Sci Rep. 2019 Aug 1;9(1):11151. doi: 10.1038/s41598-019-47629-z. Sci Rep. 2019. PMID: 31371793 Free PMC article.
-
Electroactive nanoinjection platform for intracellular delivery and gene silencing.J Nanobiotechnology. 2023 Aug 17;21(1):273. doi: 10.1186/s12951-023-02056-1. J Nanobiotechnology. 2023. PMID: 37592297 Free PMC article.
-
Genetic code expansion in mammalian cells: A plasmid system comparison.Bioorg Med Chem. 2020 Dec 15;28(24):115772. doi: 10.1016/j.bmc.2020.115772. Epub 2020 Sep 19. Bioorg Med Chem. 2020. PMID: 33069552 Free PMC article.
-
Systematic Screening of Commonly Used Commercial Transfection Reagents towards Efficient Transfection of Single-Stranded Oligonucleotides.Molecules. 2018 Oct 8;23(10):2564. doi: 10.3390/molecules23102564. Molecules. 2018. PMID: 30297632 Free PMC article.
-
Efficient mRNA Delivery In Vitro and In Vivo Using a Polycharged Biodegradable Nanomaterial.Int J Mol Sci. 2024 Dec 19;25(24):13620. doi: 10.3390/ijms252413620. Int J Mol Sci. 2024. PMID: 39769382 Free PMC article.
References
-
- Lengner CJ, Lepper C, van Wijnen AJ, Stein JL, Stein GS, Lian JB. Primary mouse embryonic fibroblasts: a model of mesenchymal cartilage formation. J Cell Physiol 2004;200:327–333. - PubMed
-
- Shimabuku T, Tamanaha A, Kitamura B, Tanabe Y, Tawata N, Ikehara F, Arakaki K, Kinjo T. Dual expression of Epstein-Barr virus, latent membrane protein-1 and human papillomavirus-16 E6 transform primary mouse embryonic fibroblasts through NF-κB signaling. Int J Clin Exp Pathol 2014;7:1920–1934. - PMC - PubMed
-
- Takahashi K, Yamanaka S. Induction of pluripotent stem cells from mouse embryonic and adult fibroblast cultures by defined factors. Cell 2006;126:663–676. - PubMed
-
- Efe JA, Hilcove S, Kim J, Zhou H, Ouyang K, Wang G, Chen J, Ding S. Conversion of mouse fibroblasts into cardiomyocytes using a direct reprogramming strategy. Nat Cell Biol 2011;13:215–222. - PubMed
Publication types
MeSH terms
Substances
Grants and funding
LinkOut - more resources
Full Text Sources
Other Literature Sources