

Deciphering Genomic Regions for High Grain Iron and Zinc Content Using Association Mapping in Pearl Millet
- PMID: 28507551
- PMCID: PMC5410614
- DOI: 10.3389/fpls.2017.00412
Deciphering Genomic Regions for High Grain Iron and Zinc Content Using Association Mapping in Pearl Millet
Abstract
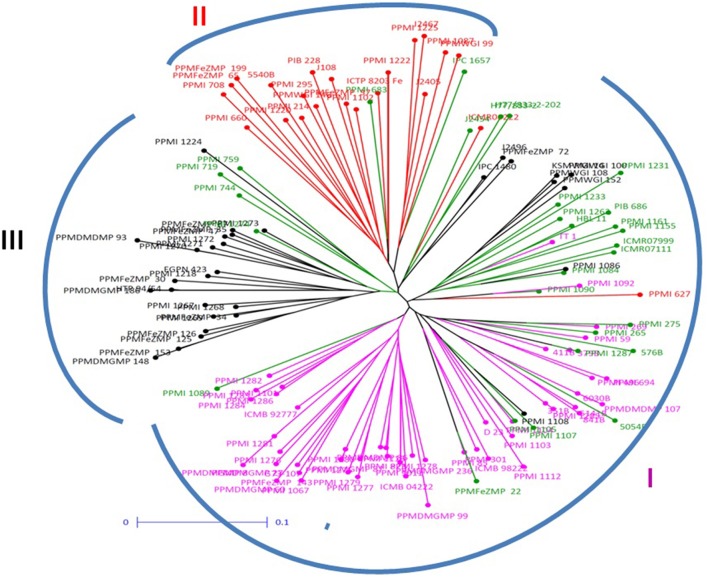
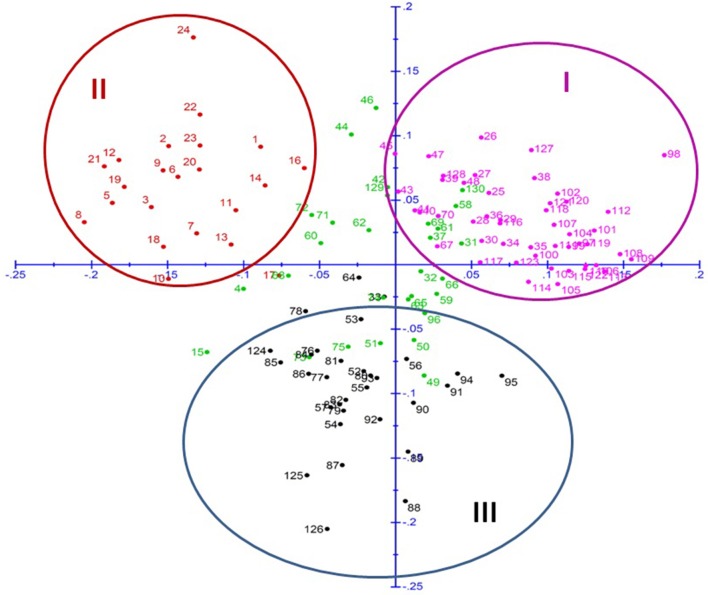
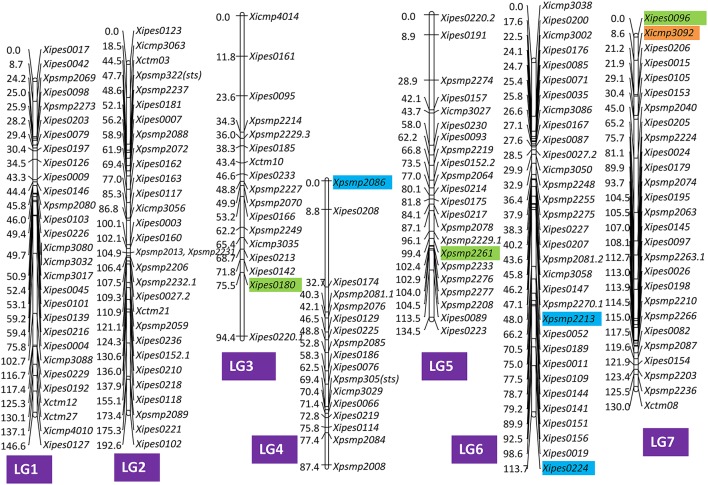
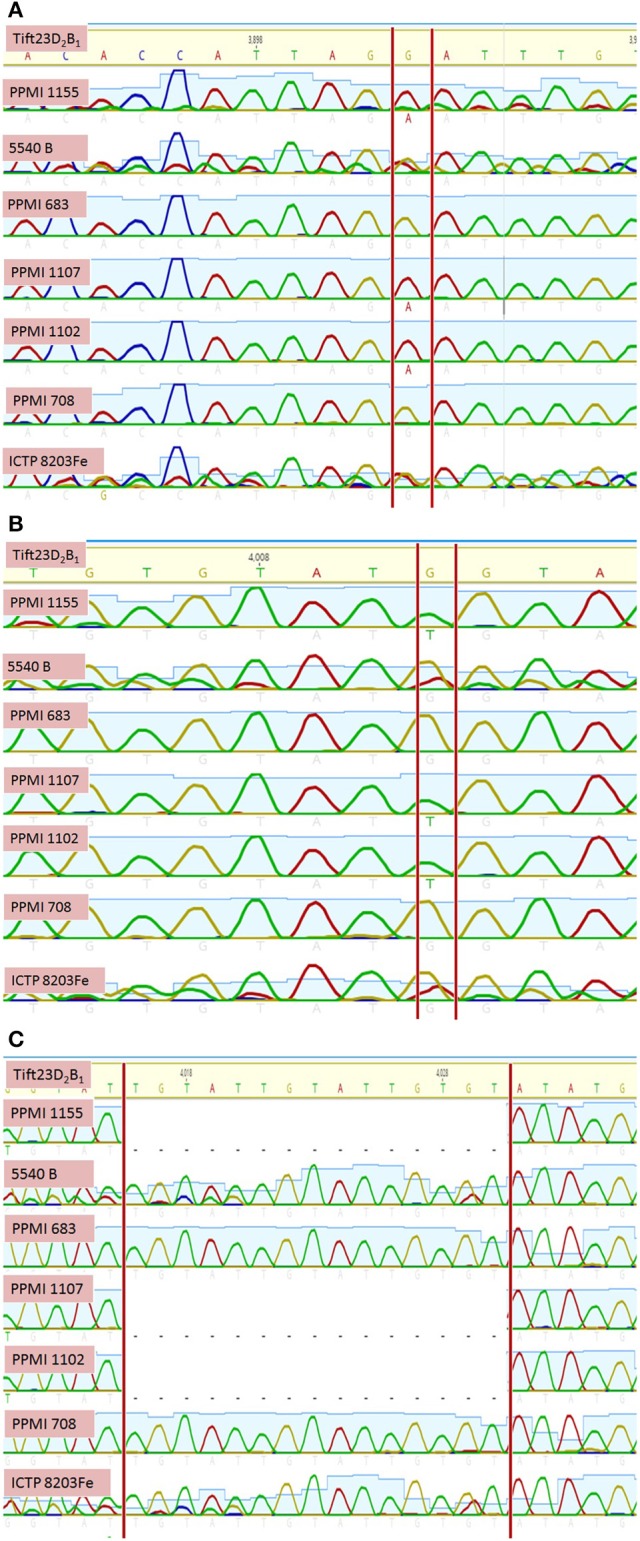
Micronutrient malnutrition, especially deficiency of two mineral elements, iron [Fe] and zinc [Zn] in the developing world needs urgent attention. Pearl millet is one of the best crops with many nutritional properties and is accessible to the poor. We report findings of the first attempt to mine favorable alleles for grain iron and zinc content through association mapping in pearl millet. An association mapping panel of 130 diverse lines was evaluated at Delhi, Jodhpur and Dharwad, representing all the three pearl millet growing agro-climatic zones of India, during 2014 and 2015. Wide range of variation was observed for grain iron (32.3-111.9 ppm) and zinc (26.6-73.7 ppm) content. Genotyping with 114 representative polymorphic SSRs revealed 0.35 mean gene diversity. STRUCTURE analysis revealed presence of three sub-populations which was further supported by Neighbor-Joining method of clustering and principal coordinate analysis (PCoA). Marker-trait associations (MTAs) were analyzed with 267 markers (250 SSRs and 17 genic markers) in both general linear model (GLM) and mixed linear model (MLM), however, MTAs resulting from MLM were considered for more robustness of the associations. After appropriate Bonferroni correction, Xpsmp 2261 (13.34% R2-value), Xipes 0180 (R2-value of 11.40%) and Xipes 0096 (R2-value of 11.38%) were consistently associated with grain iron and zinc content for all the three locations. Favorable alleles and promising lines were identified for across and specific environments. PPMI 1102 had highest number (7) of favorable alleles, followed by four each for PPMFeZMP 199 and PPMI 708 for across the environment performance for both grain Fe and Zn content, while PPMI 1104 had alleles specific to Dharwad for grain Fe and Zn content. When compared with the reference genome Tift 23D2B1-P1-P5, Xpsmp 2261 amplicon was identified in intergenic region on pseudomolecule 5, while the other marker, Xipes 0810 was observed to be overlapping with aspartic proteinase (Asp) gene on pseudomolecule 3. Thus, this study can help in breeding new lines with enhanced micronutrient content using marker-assisted selection (MAS) in pearl millet leading to improved well-being especially for women and children.
Keywords: SSR; association mapping; favorable alleles; iron and zinc; pearl millet.
Figures


References
-
- Barthakur S. (2010). Harnessing Hidden Hunger. Science Reporter. Available online at: http://nopr.niscair.res.in
-
- Bouis H. E., Welch R. M. (2010). A sustainable agricultural strategy for reducing micronutrient malnutrition in the global south. Crop Sci. 50, 20–32. 10.2135/cropsci2009.09.0531 - DOI
LinkOut - more resources
Full Text Sources
Other Literature Sources
Miscellaneous