The risk of non-union per fracture: current myths and revised figures from a population of over 4 million adults
- PMID: 28508682
- PMCID: PMC5499337
- DOI: 10.1080/17453674.2017.1321351
The risk of non-union per fracture: current myths and revised figures from a population of over 4 million adults
Abstract
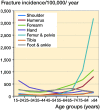
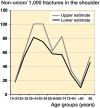
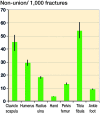
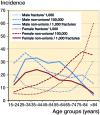
Background and purpose - Fracture non-union remains a major clinical problem, yet there are no data available regarding the overall risk of fractures progressing to non-union in a large population. We investigated the rate of non-union per fracture in a large adult population. Methods - National data collected prospectively over a 5-year period and involving just under 5,000 non-unions were analyzed and compared to the incidence of fracture in the same period. Results and interpretation - The overall risk of non-union per fracture was 1.9%, which is considerably less than previously believed. However, for certain fractures in specific age groups the risk of non-union rose to 9%. As expected, these higher rates of non-union were observed with tibial and clavicular fractures, but-less expectedly-it was in the young and middle-aged adults rather than in the older and elderly population. This study is the first to examine fracture non-union rates in a large population according to age and site, and provides more robust (and lower) estimates of non-union risk than those that are frequently quoted.
Figures


References
-
- Aitken S A. Thesis: The epidemiology of upper limb, lower limb and pelvic fractures in adults In: Department of Trauma and Orthopaedics. University of Edinburgh; 2013.
-
- Bhandari M, Guyatt G H, Swiontkowski M F, Tornetta P 3rd, Sprague S, Schemitsch E H.. A lack of consensus in the assessment of fracture healing among orthopaedic surgeons. J Orthop Trauma 2002; 16(8): 562–6. - PubMed
-
- Bhandari M, Tornetta P 3rd, Sprague S, Najibi S, Petrisor B, Griffith L, Guyatt G H.. Predictors of reoperation following operative management of fractures of the tibial shaft. J Orthop Trauma 2003; 17(5): 353–61. - PubMed
-
- Calori G M, Phillips M, Jeetle S, Tagliabue L, Giannoudis P V.. Classification of non-union: need for a new scoring system? Injury 2008; 39Suppl2: S59–S63. - PubMed
MeSH terms
LinkOut - more resources
Full Text Sources
Other Literature Sources
Research Materials
