. 2017 May 16:6:e24623.
doi: 10.7554/eLife.24623.

Macrophages are necessary for epimorphic regeneration in African spiny mice

Affiliations

Macrophages are necessary for epimorphic regeneration in African spiny mice

Jennifer Simkin et al. Elife. .

Abstract

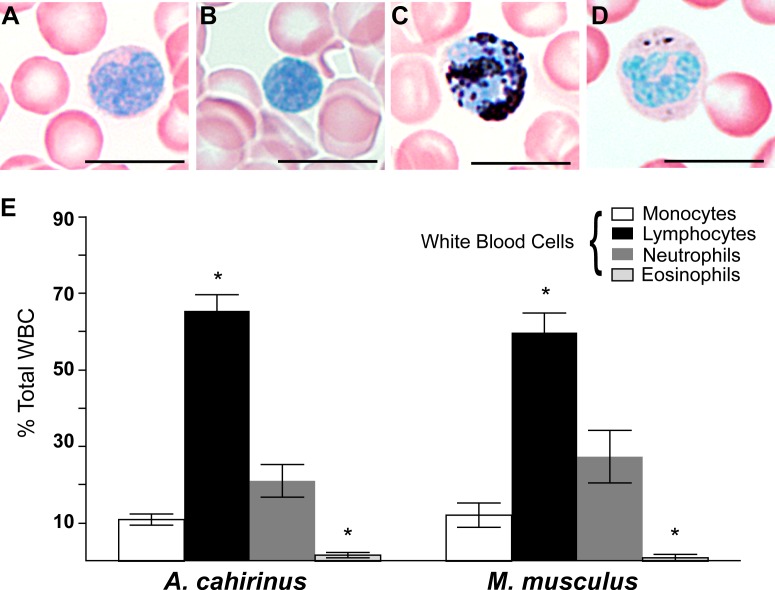
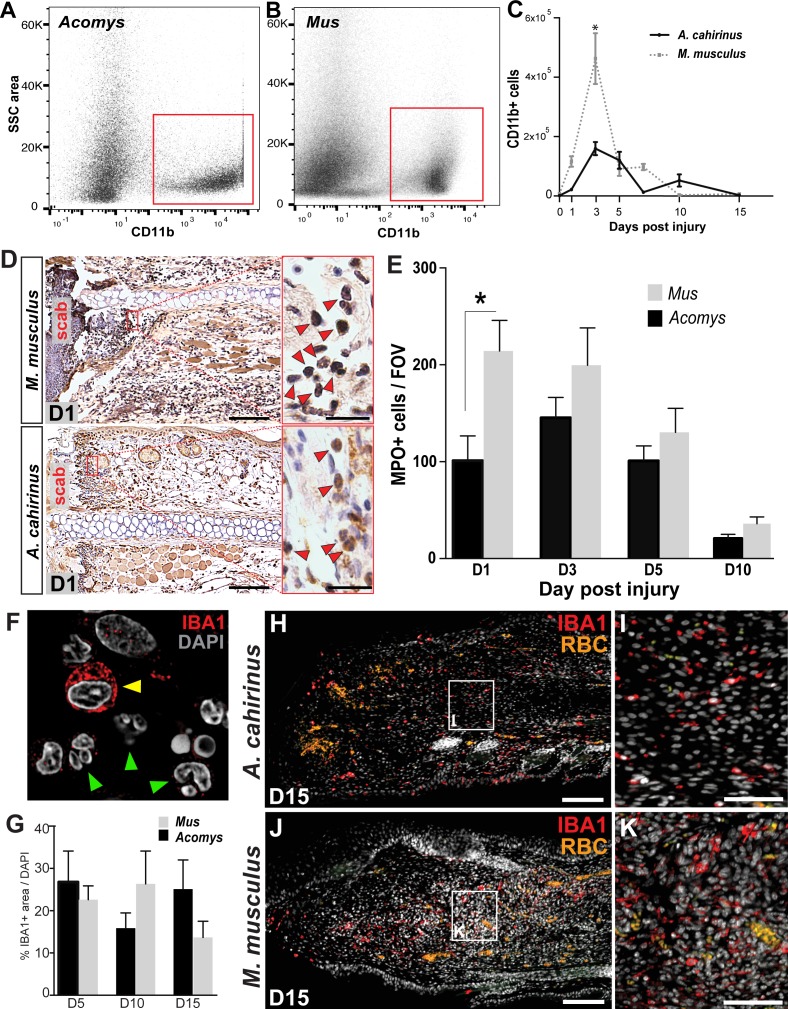
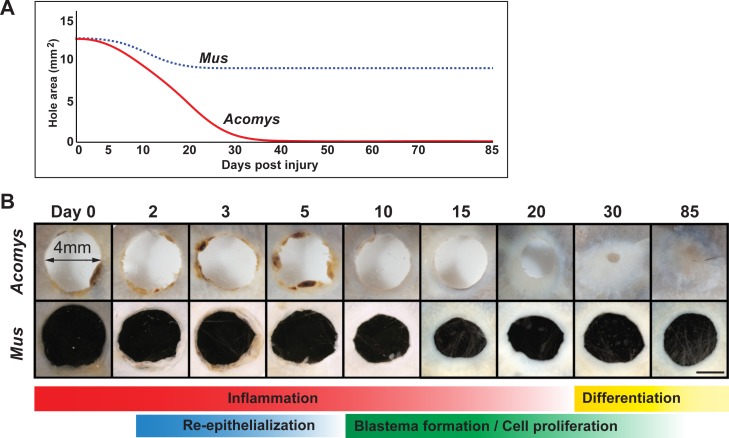
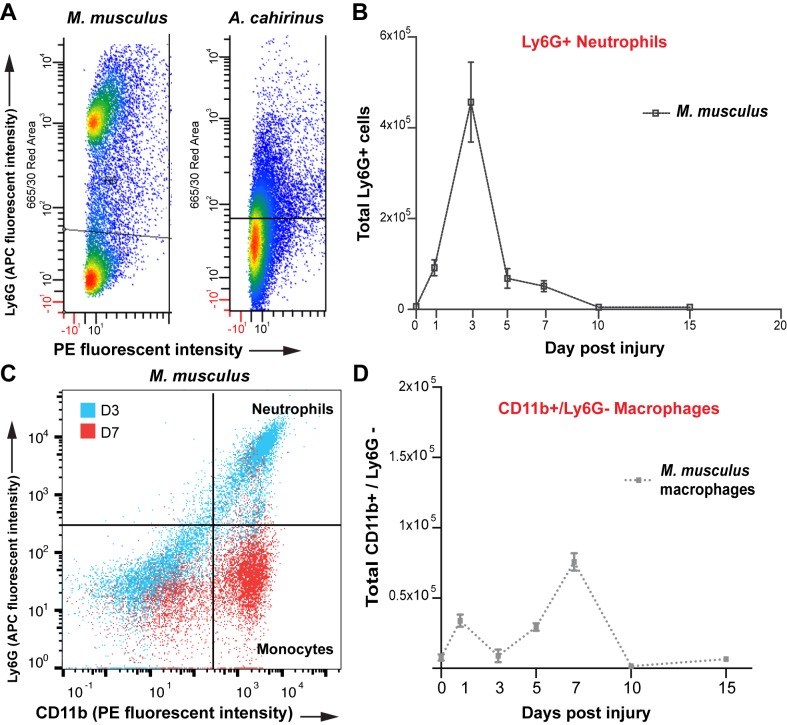
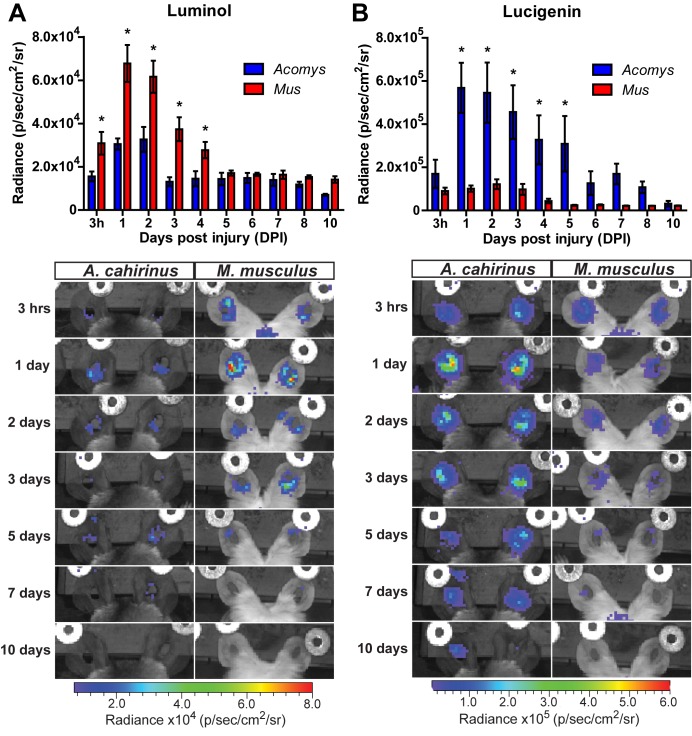
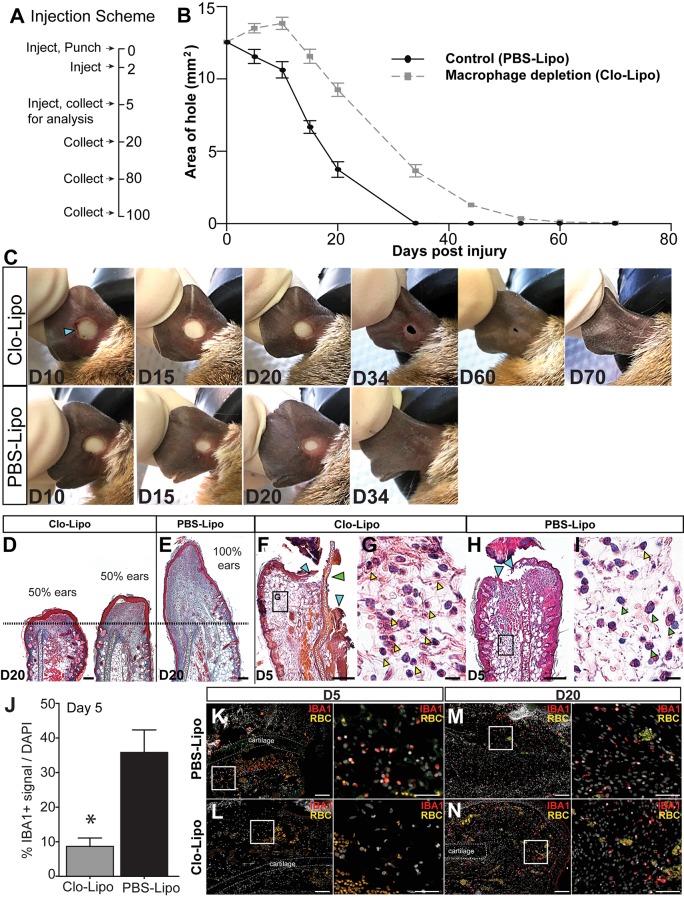
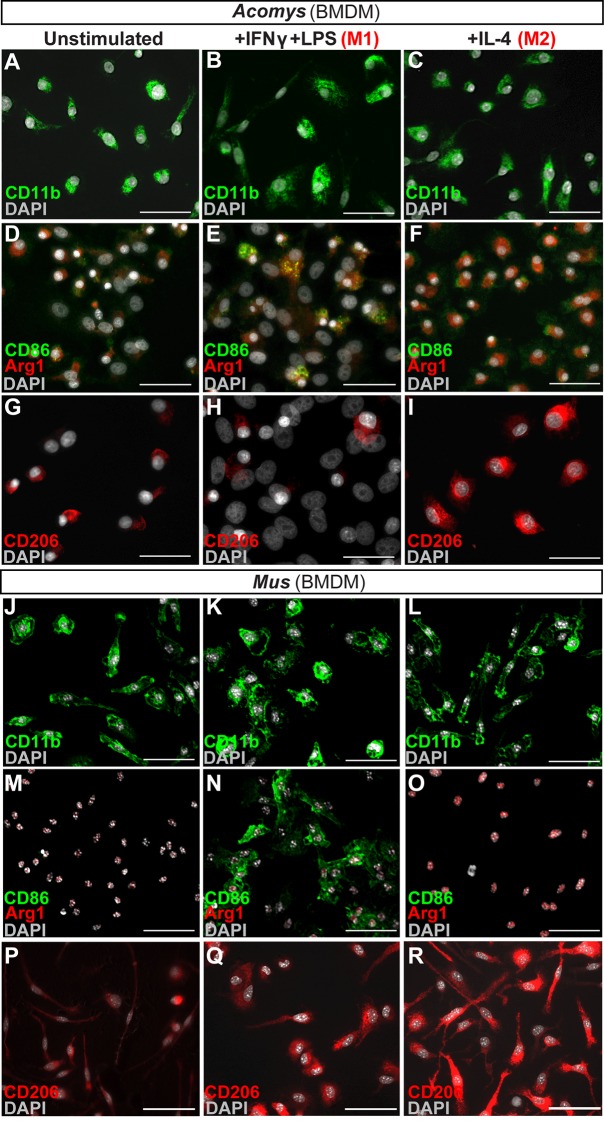
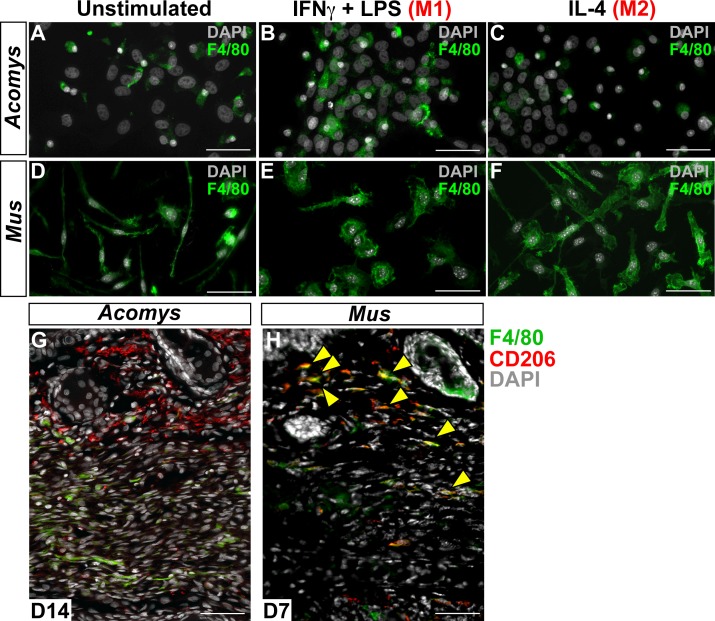
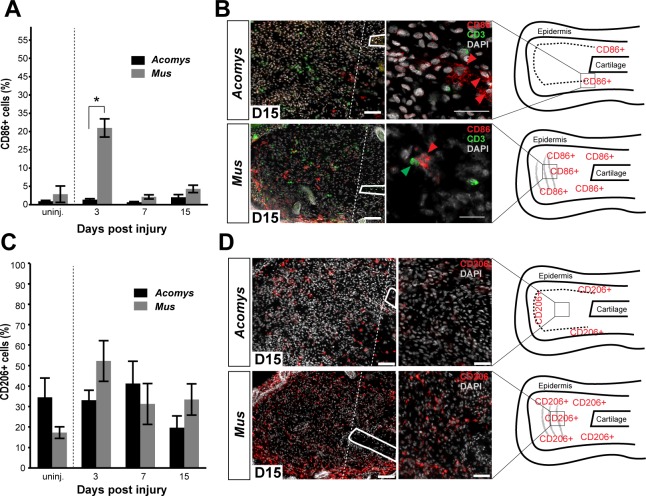
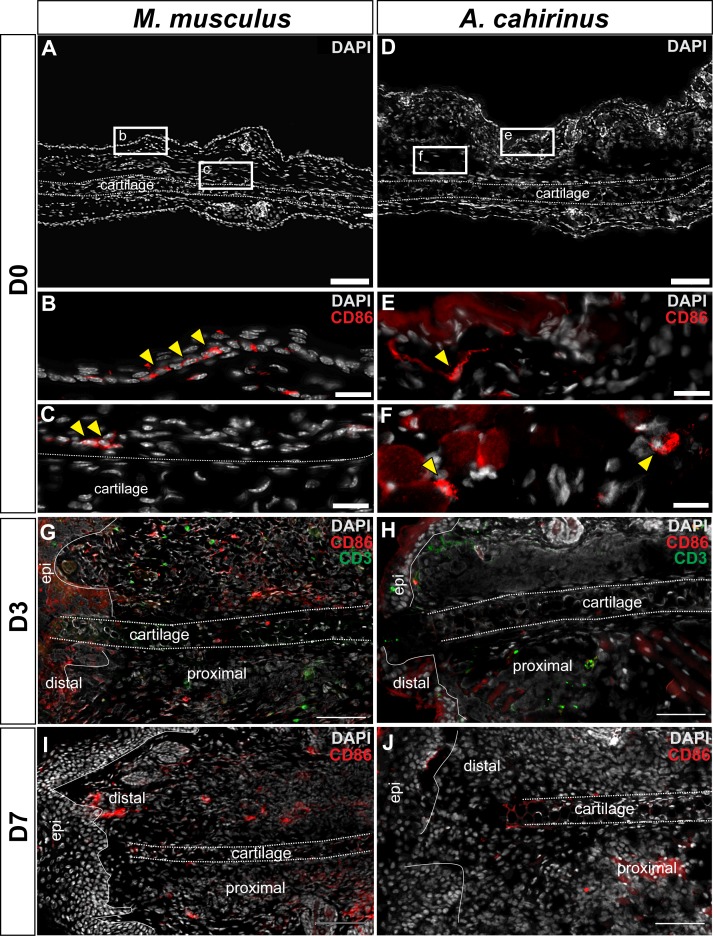
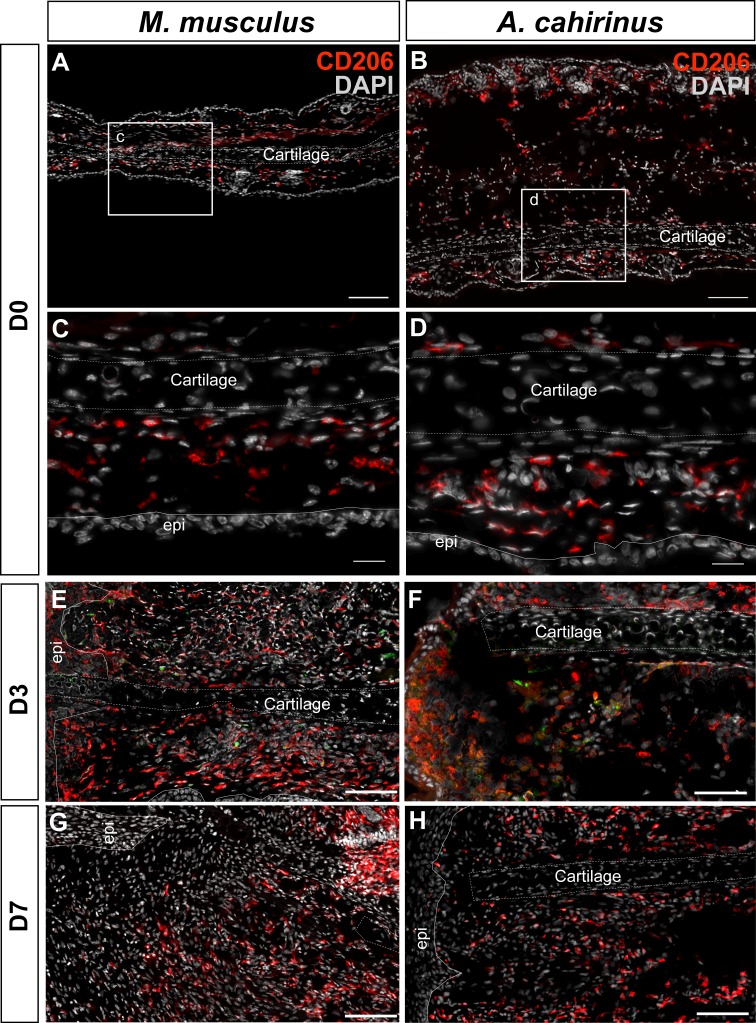
How the immune system affects tissue regeneration is not well understood. In this study, we used an emerging mammalian model of epimorphic regeneration, the African spiny mouse, to examine cell-based inflammation and tested the hypothesis that macrophages are necessary for regeneration. By directly comparing inflammatory cell activation in a 4 mm ear injury during regeneration (Acomys cahirinus) and scarring (Mus musculus), we found that both species exhibited an acute inflammatory response, with scarring characterized by stronger myeloperoxidase activity. In contrast, ROS production was stronger and more persistent during regeneration. By depleting macrophages during injury, we demonstrate a functional requirement for these cells to stimulate regeneration. Importantly, the spatial distribution of activated macrophage subtypes was unique during regeneration with pro-inflammatory macrophages failing to infiltrate the regeneration blastema. Together, our results demonstrate an essential role for inflammatory cells to regulate a regenerative response.

Keywords: Acomys; cell biology; developmental biology; epimorphic regeneration; inflammation; macrophages; mouse; stem cells.


Conflict of interest statement

The authors declare that no competing interests exist.

Figures

Figure 1.
Figure 1.. Circulating leukocyte profiles from uninjured animals are the same in A. cahirinus and M. musculus.
(A–D) Sudan-Black B modified Giemsa Wright stain helps identify leukocyte subtypes based on morphology and stain in blood smears of A. cahirinus. Monocytes (A) show kidney shaped nucleus and diffuse cytoplasmic stain; lymphocytes (B) show round nuclei encompassing most of the cell with very little cytoplasm; polymorphonuclear neutrophils (C) show dense black staining of cytoplasmic granules and a banded, multi-lobed nucleus; and eosinophils (D) show dense pink staining of cytoplasmic granules and multi-lobed nucleus. Scale bar = 10 μm. (E) Counts of white blood cell subtypes as a percentage of total white blood cells (two-way ANOVA for main effects species F = 0.01, p=0.92; and leukocyte subtype effect F = 97.04, p<0.0001. *Tukey's multiple comparison test for simple effect leukocyte subtype p<0.05 indicating significant differences when comparing neutrophils versus lymphocytes, neutrophils versus eosinophils, lymphocytes versus monocytes, and lymphocytes versus eosinophils within each species; S.E.M.; n = 8 Acomys; n = 4 Mus). DOI: http://dx.doi.org/10.7554/eLife.24623.003
Figure 2.
Figure 2.. Acute infiltration of neutrophils and macrophages is a hallmark of regeneration and scarring.
(A–B). Single-cell suspensions of whole tissue isolates from injured ears at D5 subjected to flow cytometry using CD11b show two distinct populations of cells, one CD11b- and one CD11b+ (red boxes) in Acomys (A) and Mus (B). (C) Quantifying cells over time using flow cytometry shows a peak increase of CD11b+ cells in Mus at D3 and a broader but smaller peak of CD11b+ cells in Acomys between D3 and 5 (two-way ANOVA main effect time F = 31.86, p<0.0001, main effect species, F = 17.02, p=0.0002, *Sidak's multiple comparison test p<0.05, n = 4 animals combined left and right ear/species per timepoint). (D) Representative images of immunohistochemistry for myeloperoxidase (brown) in M. musculus (top panel) and A. cahirinus (bottom panel) 24 hr post injury. Nuclei (blue) were counterstained with Mayer’s Hematoxylin. Magnification 200x, Scale bars = 50 μm. Inset images highlight polymorphonuclear appearance of positively stained cells (red arrows). Scale bars = 20 μm. (E) Cell counts of polymorphonuclear/MPO+ cells in healing tissue per field of view (FOV) (n = 5 animals/species, D1; n = 6 animals/species, D3, D5; n = 4 animals/species, D10, two-way ANOVA, main effect time and species F = 11.12, p<0.0001, F = 8.229, p=0.007 respectively, *p<0.05 Sidak’s multiple comparisons test at time points indicated). (F) Myeloid protein IBA1 (red) reactivity in Acomys ear tissue at D5 showing distinct positive cells (yellow arrow) and negative cells with multi-lobed nuclei characteristic of neutrophils (green arrows). DAPI = grey, IBA1 = red. (G) Quantification of the total IBA1+ area in Acomys and Mus ears at D5, D10 and D20 normalized to total DAPI+ area (n = 3/species, two-way ANOVA, main effect time and species F = 0.132, p=0.723, F = 0.438, p=0.655, respectively) (H–K) Representative images of the IBA-1+ area quantified in (G) at D15. IBA-1+ cells localize proximal and distal to the injury site in Acomys and Mus and within the blastema in Acomys. IBA-1 = red, DAPI = grey, autofluorescent red blood cells (RBC) = orange. Scale bars (H,J) = 100 μm. Scale bar (I,K) = 50 μm Distal = left, Dorsal = top of image. DOI: http://dx.doi.org/10.7554/eLife.24623.005
Figure 2—figure supplement 1.
Figure 2—figure supplement 1.. Timeline of regeneration following 4 mm ear punch injury in Acomys compared to scar-formation in Mus.
(A) Schematized graph showing ear hole area over time adapted from Gawriluk et al. (2016). Mus = blue dotted line, Acomys = red solid line. (B) Whole mount ear pinna photographs during regeneration (Acomys - top panel) and scarring (Mus - bottom panel) at indicated timepoints post injury. Scale bar = 2 mm. Colored bars align key processes (e.g. inflammation, re-epithelialization, blastema formation, etc.) as a function of days post injury. Data represented here from Gawriluk et al. (2016), Seifert et al. (2012a). DOI: http://dx.doi.org/10.7554/eLife.24623.006
Figure 2—figure supplement 2.
Figure 2—figure supplement 2.. Isolation of monocytes using flow cytometry.
(A) Flow cytometric analysis using Ly6G antibody to detect positive cells from whole tissue isolates of the injured ear at D5. Mus shows two distinct populations of cells, one Ly6G negative and one Ly6G positive. Acomys did not show two distinct populations of cells as expected due to lack of the Ly6G gene (B) Tracking Ly6G+ cells over time in Mus using flow cytometry for total cell count shows an acute peak of positive cells at D3. (n = 4 Mus, 8 ears/timepoint. ANOVA main effect time, F = 21.14 p<0.0001). (C) FACS analysis for neutrophils versus monocytes in Mus using Ly6G antibody. Gating for CD11b+/Ly6G+ neutrophils (upper right quadrant) and CD11b+/Ly6G– monocytes (lower right quandrant) at D3 (blue dots) and D7 (red dots) shows a shift in cell populations over time post injury with neutrophils being more abundant at D3 and almost completely absent by D7. (D) Quantitation of FACS analysis of total CD11b+/Ly6G- cell counts over time in Mus (n = 4 Mus, 8 ears/timepoint). DOI: http://dx.doi.org/10.7554/eLife.24623.007
Figure 3.
Figure 3.. Acute myeloperoxidase activity is elevated during scarring, while reactive oxygen species production is elevated during regeneration.
(A–B) In vivo imaging of the chemiluminescent compounds luminol and lucigenin, showing myeloperoxidase activity (A) or ROS production (B) in the injured ears of Mus (red bars) and Acomys (blue bars). Images below graphs are representative for each timepoint. Chemiluminescence is measured in radiance [photons (p) per second (s) emitted from a square centimeter of tissue (cm2) and radiating into a solid angle of one steradian (sr)]. For luminol experiments: n = 7 Mus (14 ears) and n = 6 Acomys (12 ears) repeated measures ANOVA, F = 5.095, p<0.001 and for lucigenin experiments: n = 8 Mus (16 ears) and n = 6 Acomys, (12 ears), repeated measures ANOVA F = 4.536, p<0.001, *p<0.05 Sidak's multiple comparison test between species at the time indicated. DOI: http://dx.doi.org/10.7554/eLife.24623.009
Figure 4.
Figure 4.. Macrophage depletion with clodronate liposomes inhibits regeneration.
(A) Ears were injected with clodronate liposomes (Clo-Lipo) or PBS liposome controls (PBS-Lipo) at D0 immediately before injury, D2 after injury and at D5. Ears were allowed to regenerate and tissue collected at later time points. (B) Wound size was measured over time. PBS-lipo ears close completely by D34 (black line, graph, bottom panel images). Clo-Lipo ears remain open until D70 (grey dotted line, graph, top panel images, n = 6 animals, 12 ears per treatment). (C) Representative ear from Clo-Lipo (top panel) and PBS-Lipo (bottom panel) followed over time. (D–E) H & E stained Clo-Lipo ear at D20 shows variable reduction in cell accumulation past the injury site (black dotted line) with relatively little new growth compared to PBS-Lipo ears. Scale bar = 100 μm. (F–I) H & E stained Clo-Lipo ear at D5 (F) shows a delay in epidermal closure (blue arrows) and loss cartilage plate histolysis (green arrow) compared to PBS-Lipo ears (H). Scale bar = 200 μm. (G) Boxed region in (F) showing accumulation of polymorphonuclear cells (yellow arrowheads). (I) Boxed region in (H) with monocytic cells evident (green arrowheads) and few polymorphonuclear cells present (yellow arrowhead). Scale bar = 10 μm. (J–N) IBA-1 immuno-positive area following macrophage depletion compared to control. Total IBA-1+ area normalized to total DAPI+ area at D5 after the final treatment (J, n = 3 animals per treatment, *unpaired Student's t-test p<0.05). IBA-1+ cells in PBS-lipo tissue at D5 (K) compared to Clo-lipo tissue at D5 (L). IBA1+ cells in PBS-Lipo tissue at D20 (M) and Clo-lipo treated tissue at D20 (N) show a return of positive cells.. Scale bar = 100 μm. Box delineates area of high-magnification images, Scale bar = 50 μm. IBA-1 = red, DAPI = grey, autofluorescent red blood cells (RBC) = orange. Distal = left, Dorsal = top. DOI: http://dx.doi.org/10.7554/eLife.24623.010
Figure 5.
Figure 5.. In vitro activation assays shows Acomys macrophages can be polarized to express different markers.
(A–I) Bone-marrow-derived macrophages isolated from Acomys femurs are cultured with no cytokines (unstimulated, A, D, G) with IFNγ+LPS (M1, B, E, H) or with IL-4 (M2, C, F, I). Immunocytochemistry for the pan-macrophage marker CD11b (green) (A–C), for the M1 macrophage marker CD86 (green) and the M2 macrophage marker Arginase 1 (red) (D–F), or CD206 (red) (G–I). (J–R). Bone-marrow-derived macrophages were isolated from Mus femurs and cultured with no cytokines (J, M, P) with IFNγ and LPS (K, N, Q) or with IL4 (L, O, R) as above. Immunocytochemistry was performed for CD11b (green) (J–K), for CD86 (green) and Arginase 1 (red) (M–O), and CD206 (red) (P–R). Nuclei were counterstained with DAPI (grey) in all panels. Scale bars = 50 μm. Images are representative of n = 3 technical replicates. DOI: http://dx.doi.org/10.7554/eLife.24623.011
Figure 5—figure supplement 1.
Figure 5—figure supplement 1.. Immunofluorescent staining for macrophage marker F4/80 in Acomys and Mus.
(A–C) Bone-marrow-derived cells isolated from Acomys and stained for F4/80 (green). (A) unstimulated cells, (B) cells stimulated with IFNγ and LPS, (C) cells stimulated with IL-4. (D–F) Bone-marrow-derived cells isolated from Mus and stained for F4/80 (green). (D) unstimulated cells, (E) cells stimulated with IFNγ and LPS, and (F) cells stimulated with IL-4. Scale bar = 50 μm. (G) Acomys ear tissue at D15 after injury stained for F4/80 (green), CD206 (red) and DAPI (grey). (H) Mus ear tissue at D7 after injury stained for F4/80 (green), CD206 (red) and DAPI (grey). Scale bar = 50 μm. DOI: http://dx.doi.org/10.7554/eLife.24623.012
Figure 6.
Figure 6.. Activated CD86+ macrophages are restricted from the blastema in Acomys.
(A) Immunofluorescent staining for the cell surface marker CD86 in Acomys and Mus at specific time points after injury as a percent of total area analyzed (n = 4 per time point; two-way ANOVA main effect time and species F = 131.8, p<0.0001, F = 220.0, p<0.0001 *Sidak's multiple comparison test p<0.05 at time point indicated). (B) Left panels 10x magnification, CD86 (red), DAPI (grey). Scale bar = 100 μm. White lines delineate cartilage. Middle panel, 40x magnification, CD86 (red), DAPI (grey). Scale bar = 20 μm. Right panel, diagram with the general overview of CD86+ localization at D15 and delineating high-magnification area (box). (C) Immunofluorescent staining for the cell surface marker CD206 in Acomys and Mus as a percent of total area analyzed (n = 4 per time point per species, two-way ANOVA main effect time and species, F = 2.33, p=0.125, F = 1.54, p=0.230 respectively). (D) Left panel magnification 10x. CD206 (red), DAPI (grey). Scale bar = 100 μm. White lines delineate cartilage. Middle panel 20x magnification. CD206 (red), DAPI (grey). Scale bar = 50 μm. Right panel, Schematic depicting the general trends for CD206+ cell localization in Acomys and Mus at D15. Box delineates the location of the high-magnification images. DOI: http://dx.doi.org/10.7554/eLife.24623.013
Figure 6—figure supplement 1.
Figure 6—figure supplement 1.. Immunofluorescent staining for CD86+ cells at D0, D3 and D7 post injury in Mus and Acomys.
(A–C) CD86+ cells in Mus ear before injury (D0). (A) 10x magnification image of the Mus ear before injury. Scale bar = 100 μm. (B) High magnification of (A) reveals CD86+ cells in the epidermis before injury and (C) in the perichondrium and surrounding dermis (yellow arrows). Scale bars = 20 μm. (D–F) CD86+ cells in Acomys ear before injury. (D) 10x magnification of Acomys ear for reference. Scale bar = 100 μm (E) High magnification of (D) showing CD86+ cells in the dermis underlying the epidermis at D0 (yellow arrow). (F) CD86+ cells (yellow arrows) located in the adipose tissue layer of the ear. Scale bar = 20 μm. (G) Representative image of Mus ear at D3 showing CD86+ cell localization. (H) Representative image of Acomys ear at D3 showing few CD86+ cells in the injury site. (I) CD86+ staining in the Mus ear at D7 showing positive cells distal to the injury site. (J) CD86+ cells in the Acomys ear at D7 showing very few positive stained cells distal to the injury site. Scale bar = 50 μm CD86 = red, CD3 = green, DAPI = grey. Epi = epidermis. DOI: http://dx.doi.org/10.7554/eLife.24623.014
Figure 6—figure supplement 2.
Figure 6—figure supplement 2.. Immunofluorescent staining for CD206+ cells at D0, D3, D7 post injury in Mus and Acomys.
(A–H) CD206 staining in Mus (A, C, E, G) and Acomys (B, D, F, H). (A) CD206+ cells in ear before injury in Mus and (B) in Acomys. Scale bar = 100 μm. (C) High magnification of (A) showing CD206+ cells in dermis of Mus ear before injury. (D) High magnification of (B) showing CD206+ cells in dermis of Acomys ear before injury. Scale bar = 20 μm. (E) CD206+ cells in Mus ear and (F) Acomys ear at 3 days post injury. (G) CD206+ cells in Mus ear and (H) Acomys ear at 7 days post injury. Scale bar = 50 μm. CD206 = red, DAPI = grey and Epi = epidermis. DOI: http://dx.doi.org/10.7554/eLife.24623.015

Similar articles

Cited by

References

    1. Alexander KA, Chang MK, Maylin ER, Kohler T, Müller R, Wu AC, Van Rooijen N, Sweet MJ, Hume DA, Raggatt LJ, Pettit AR. Osteal macrophages promote in vivo intramembranous bone healing in a mouse tibial injury model. Journal of Bone and Mineral Research. 2011;26:1517–1532. doi: 10.1002/jbmr.354. - DOI - PubMed
    1. Aliprantis AO, Wang J, Fathman JW, Lemaire R, Dorfman DM, Lafyatis R, Glimcher LH. Transcription factor T-bet regulates skin sclerosis through its function in innate immunity and via IL-13. PNAS. 2007;104:2827–2830. doi: 10.1073/pnas.0700021104. - DOI - PMC - PubMed
    1. Ames C, Boland E, Szentirmai É. Effects of macrophage depletion on Sleep in mice. PLoS One. 2016;11:e0159812. doi: 10.1371/journal.pone.0159812. - DOI - PMC - PubMed
    1. Arnold L, Henry A, Poron F, Baba-Amer Y, van Rooijen N, Plonquet A, Gherardi RK, Chazaud B. Inflammatory monocytes recruited after skeletal muscle injury switch into antiinflammatory macrophages to support myogenesis. The Journal of Experimental Medicine. 2007;204:1057–1069. doi: 10.1084/jem.20070075. - DOI - PMC - PubMed
    1. Aurora AB, Porrello ER, Tan W, Mahmoud AI, Hill JA, Bassel-Duby R, Sadek HA, Olson EN. Macrophages are required for neonatal heart regeneration. Journal of Clinical Investigation. 2014;124:1382–1392. doi: 10.1172/JCI72181. - DOI - PMC - PubMed

Publication types