. 2017 May 16:8:15296.
doi: 10.1038/ncomms15296.

Plastic roles of pericytes in the blood-retinal barrier

Affiliations

Plastic roles of pericytes in the blood-retinal barrier

Do Young Park et al. Nat Commun. .

Abstract

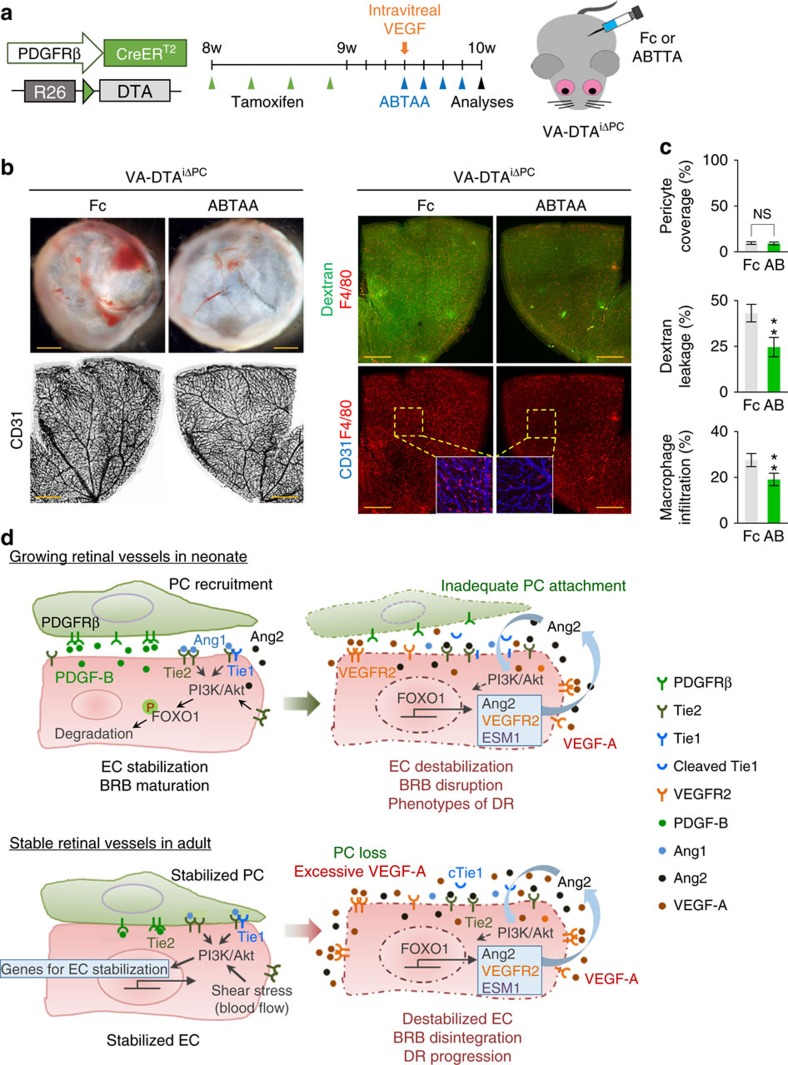
The blood-retinal barrier (BRB) consists of tightly interconnected capillary endothelial cells covered with pericytes and glia, but the role of the pericytes in BRB regulation is not fully understood. Here, we show that platelet-derived growth factor (PDGF)-B/PDGF receptor beta (PDGFRβ) signalling is critical in formation and maturation of BRB through active recruitment of pericytes onto growing retinal vessels. Impaired pericyte recruitment to the vessels shows multiple vascular hallmarks of diabetic retinopathy (DR) due to BRB disruption. However, PDGF-B/PDGFRβ signalling is expendable for maintaining BRB integrity in adult mice. Although selective pericyte loss in stable adult retinal vessels surprisingly does not cause BRB disintegration, it sensitizes retinal vascular endothelial cells (ECs) to VEGF-A, leading to upregulation of angiopoietin-2 (Ang2) in ECs through FOXO1 activation and triggering a positive feedback that resembles the pathogenesis of DR. Accordingly, either blocking Ang2 or activating Tie2 greatly attenuates BRB breakdown, suggesting potential therapeutic approaches to reduce retinal damages upon DR progression.


Conflict of interest statement

The authors declare no competing financial interests.

Figures

Figure 1
Figure 1. Pericyte coverage is critical for formation and maturation of BRB.
(a) Abundant PDGF-B mRNA expression in the tip ECs of vascular front (white arrowheads) at P5. PDGF-B mRNA was analysed by in situ hybridization (ISH), and then collagen type IV (ColIV) was detected by immunohistochemistry (IHC). (b) Immunostaining for PDGFRβ+ pericytes and CD31+ ECs in vascular front at P5. Note that there is no pericyte coverage in tip ECs (arrows). (c) Diagram for EC-specific depletion of PDGF-B in retinal vessels from P5 and their analyses at P12 using PdgfbiΔEC mice. (df) Images of hemorrhage (red) and retinal detachment (dashed-line circle) in inner surface of retinal cup, and whitish inflammatory cell accumulations (white arrowheads) and irregular CD31+ vascular plexus in retinas of PdgfbiΔEC mice are shown. (g) Images of NG2+ and PDGFRβ+ pericyte coverage onto CD31+ vessels, TER119+ RBC leakage (white arrowheads), F4/80+ macrophage infiltration, lectin perfusion, distributions of ZO-1 and VE-cadherin onto CD31+ ECs, and hypoxic area in retinas of WT and PdgfbiΔEC mice are shown. HP, hypoxyprobe. (h) Comparisons of indicated parameters in WT (W; n=6) and PdgfbiΔEC (P; n=6) mice. Error bars represent mean±s.d. **P<0.01 versus WT by Mann-Whitney U test. Scale bars, 100 μm (white, black) and 500 μm (yellow).
Figure 2
Figure 2. Inadequate pericyte coverage impairs BRB and vision.
(a) Diagram depicting the experiment schedule for EC specific deletion of PDGF-B in retinal vessels from P5 and their analyses at P30 in PdgfbiΔEC mice. (b,c) Images of inner surface and vascular plexus in retinas of WT and PdgfbiΔEC mice. Vitreous hemorrhage (arrow) and severely impaired vascular network are detected in PdgfbiΔEC mice. (d) Comparisons of indicated parameters in WT (W; n=6) and PdgfbiΔEC (P; n=6) mice. (e) Electroretinography in WT and PdgfbiΔEC mice. Normal ERG responses showing photopic b wave and scotopic a and b waves in WT mice (black line) are hardly detected in PdgfbiΔEC mice (red line). Arrows, flash stimuli. Scale bars (green), 40 ms (x) and 40 μm (y) in photopic ERG, 40 ms (x) and 160 μm (y) in scotopic ERG. (f) Comparisons of amplitude of photopic b wave and scotopic a and b waves by the stimulus of 1.6 log cd s m−2 in WT (W; n=6) and PdgfbiΔEC (P; n=6) mice. (g) Images showing impaired CD31+ vascular plexus in superficial, intermediate and deep layers, enlarged CD31+ vessels, detached or no NG2+ pericyte coverage, abundant F4/80+ macrophage infiltration and TER119+ RBC leakage (arrows), severe hypoxia, detached SMA+ SMCs from the CD31+ vessels (yellow arrowheads), and caspase-3+ apoptotic ECs (white arrowheads) are largely detected in retinas of PdgfbiΔEC mice compared with those of WT mice. HP, hypoxyprobe. (h) Comparisons of indicated parameters in WT (W; n=6) and PdgfbiΔEC (P; n=6) mice. Error bars represent mean±s.d.**P<0.01 versus WT by Mann–Whitney U test. Scale bars, 100 μm (white) and 500 μm (black).
Figure 3
Figure 3. Inadequate pericyte coverage activates FOXO1-Ang2 axis in ECs.
(a,b) Images and comparisons of Ang2 and Tie2 expressions in vascular front of retinas of WT mice at P5. Tip ECs that are not covered with NG2+ pericytes (arrowheads) express high Ang2 and low Tie2. Analyses were performed in 6 representative areas per retina in WT mice (n=6). (c) Diagram depicting the experiment schedule for EC-specific deletion of PDGF-B in retinal vessels from P5 and their analysis at P10 in PdgfbiΔEC mice. (d,e) Images and comparisons of Ang2 and Tie2 expressions in CD31+ vessels. Increased expression of Ang2 are observed in vascular front and microaneurysm, while Tie2 expression is decreased in retinal vessels of PdgfbiΔEC mice (P; n=6) compared with WT mice (W; n=6). (f) Expressions and localizations of FOXO1 and Tie2 in vascular front of WT mice at P5 and in vascular plexus at P10 in WT mice and PdgfbiΔEC mice. Note that nuclear localization of FOXO1 (arrows) is evident in Tie2-low tip ECs of WT mice and pericyte-detached ECs in PdgfbiΔEC mice. (g) Quantification of the nuclear FOXO1 in the CD31+ vessels in WT (W; n=6) and PdgfbiΔEC (P; n=6) mice. (h) Comparison of soluble Tie1 in vitreous fluid of eyes of WT (W; n=6) and PdgfbiΔEC (P; n=6). (i) Expressions, localizations, and comparisons of ESM1, VEGFR2 and Tie1 in CD31+ retinal vessels of WT (W; n=6) and PdgfbiΔEC (P; n=6). Error bars represent mean±s.d. *P<0.05, **P<0.01 versus WT by Mann–Whitney U test. All scale bars, 100 μm.
Figure 4
Figure 4. Pericyte is not a source of Ang1 in the retinal vessels.
(a,b) Cross-sectional images of retina of Ang1-GFP knock-in mouse at P5. Note that most of GFP signals are detected in the retinal neurons (yellow arrowheads) located in ganglion cell layer and inner nuclear layer. Magnified images of boxed areas are shown below. No GFP signal was detected in NG2+ pericytes around retinal vessels (arrows), whereas positive GFP signal was detected in NG2+ pericytes around choroidal vessels (white arrowheads). (c) Images showing localization of GFP+ cells in relation to CD31+ retinal vessels and NG2+ pericytes in superficial, intermediate, and deep retinal vascular layers. GFP signals are not detected in pericytes or ECs, but detected in neurons that surround retinal vessels in superficial and intermediate vascular plexus layers. Scale bars, 100 μm (white) and 50 μm (yellow).
Figure 5
Figure 5. Tie2 is indispensable for retinal vascular growth and BRB maturation.
(a) Diagram depicting the experiment schedule for EC-specific depletion of Tie2 in retinal vessels from P1 and their analyses at P15 using Tie2iΔEC mice. (b) Images of inner surface of retinal cup of WT and Tie2iΔEC mice. Hemorrhages (arrowheads) are seen in Tie2iΔEC mice. (c) Relative levels of Tie2 mRNA in the lysates of retina and lung of Tie2iΔEC mice (Ti) mice versus WT mice (W). (d,e) Images of CD31+ vessels and comparisons of indicated parameters in W (n=6) and Ti (n=6). (f) Images of retinal vascular phenotypes in W and Ti. Note that enlarged IB4+ or CD31+ vessels with adequate NG2+ pericyte coverage have scanty expression of Tie2, while high expression of Ang2 by vessels with profound F4/80 macrophage infiltration, TER119+ RBC leakage, severe hypoxia with impaired deep vessel formation, and evident nuclear localization of FOXO1 are detected in retinas of Tie2iΔEC mice. (g) Comparisons of indicated parameters in W (n=6) and Ti (n=6). Error bars represent mean±s.d. **P<0.01 versus WT by Mann–Whitney U test. Scale bars, 100 μm (white) and 500 μm (yellow, black).
Figure 6
Figure 6. FOXO1 inactivation attenuates BRB impairments caused by lack of pericytes.
(a) Diagram depicting the experiment schedule for APB5 treatment at P1 and EC-specific depletion of FOXO1 (Foxo1iΔEC) from P5, and their analyses at P15. (b) Images of inner surface of retinal cup of WT and Foxo1iΔEC mice treated with either Fc of IgG (Fc) or APB5. Note that profound retinal hemorrhage (arrowheads) and retinal detachment (arrows) are detected in WT mice treated with APB5, but these phenotypes are largely attenuated in Foxo1iΔEC mice treated with APB5. (c,d) Images of CD31+ retinal vessels, and expressions and localizations of Ang2 and FOXO1 in CD31+ retinal vessels. Distinct retinal features such as disorganized and irregular enlarged vessels and less developed radial growth in WT mice treated with APB5 are largely ameliorated in Foxo1iΔEC mice treated with APB5. (e) Comparisons of indicated parameters in each group (n=6). (f,g) Images and comparisons of TER119+ RBC leakage and F4/80+ macrophage infiltration in retinas of each group (n=6). Error bars represent mean±s.d. *P<0.05 versus Fc-treated WT, #P<0.05 versus APB5-treated WT by Kruskal–Wallis test. Scale bars, 100 μm (white) and 500 μm (yellow, black).
Figure 7
Figure 7. Ang2 blockade ameliorates pericyte loss-induced BRB impairments.
(a) Diagram depicting the experiment schedule for EC-specific depletion of PDGF-B and Ang2 in retinal vessels from P5 and their analyses at P12 in WT (W), Ang2iΔEC (A), PdgfbiΔEC (P), and Ang2:PdgfbiΔEC (AP) mice. (b) Images of CD31+ retinal vessels, F4/80+ macrophage infiltration, FITC-conjugated dextran (2,000 kDa) leakage, and expression and localization of Ang2 in each group. Note that abnormalities such as increased macrophage infiltration, vascular leakage, or microaneurysm (arrowheads) formation in PdgfbiΔEC mice are greatly reduced in Ang2:PdgfbiΔEC mice. (c) Comparisons of indicated parameters in each group (n=6). Error bars represent mean±s.d. *P<0.05 versus W, #P<0.05 versus P by Kruskal–Wallis test. (d) Diagram depicting the experiment schedule for intravitreal injection of Ang2 blocking antibody (ABA) at P5 in WT mice that were treated with APB5 at P1, and their analyses at P8. (e,f) Images and comparisons of CD31+ vessels, NG2+ pericytes, microaneurysms (arrows), and TER119+ RBC leakages (arrowheads) in mice treated with Fc (n=6) or ABA (n=6). Error bars represent mean±s.d. **P<0.01 versus Fc by Mann–Whitney U test. Scale bars, 100 μm (white) and 500 μm (yellow).
Figure 8
Figure 8. Pericyte-free retinal vessels of adults are resistant to vascular leakage.
(a) Diagram depicting the experiment schedule for selective loss of pericytes in retinal vessels of 8-week-old mice and their analyses at 2 weeks later using DTAiΔPC mice. (b) Images of CD31+ vessels and PDGFRβ+ pericyte coverage in WT and DTAiΔPC mice. Only a small number of pericytes (arrowheads) remained in retinal arteries of DTAiΔPC mice. Right lower panels, no visible hemorrhage is found in inner surface of retinal cups in both mice. (c) Comparisons of indicated parameters in WT (W; n=6) and DTAiΔPC (D; n=6) mice. (d,e) Images and comparisons of CD31+ vessels and PDGFRβ+ pericyte coverage in three layers, SMA+ SMCs surrounding arteries, NG2+ pericyte coverage, and dextran (70 kDa) leakage in retinas in WT (W, n=6) and DTAiΔPC (D, n=6) mice. Error bars represent mean±s.d. **P<0.01 versus WT by Mann–Whitney U test. NS, non-significant. Scale bars, 100 μm (white) and 500 μm (yellow).
Figure 9
Figure 9. Additional VEGF-A is required to recapitulate the phenotypes of DR.
(a) Diagram depicting the experiment schedule for selective loss of pericytes in retinal vessels using adult DTAiΔPC mice, intra-vitreal administration of VEGF-A (1 μg) into one eye and BSA (1 μg) into the contralateral eye, and analyses at 4 days after the administration. (b,c) Images and comparisons of inner surface of retinal cup, CD31+ vessels, PDGFRβ+ pericyte coverage, expressions of Ang2 and VEGFR2 in CD31+ vessels, and dextran (70 kDa) leakage in retinas of WT and DTAiΔPC mice that were intra-vitreally treated with BSA (B) or VEGF-A (VA). Each group, n=6. Error bars represent mean±s.d. *P<0.01 versus WT treated with B, P<0.01 versus DTAiΔPC treated with B, #P<0.01 versus WT treated with VA by Kruskal–Wallis test. Scale bars, 100 μm (white) and 500 μm (yellow).
Figure 10
Figure 10. Tie2 activation lessens BRB disintegration in pericyte-free adult retina.
(a) Diagram depicting the experiment schedule for selective depletion of pericytes around retinal vessels by tamoxifen, intra-vitreal administration of VEGF-A (1 μg), and daily intra-peritoneal administration of ABTTA (20 mg kg−1) for 4 days in adult DTAiΔPC mice. Analyses were performed 4 days after VEGF-A administration. (b,c) Images and comparisons of inner surface of retinal cup, CD31+ vessels, dextran (70 kDa) leakage, and F4/80+ macrophage infiltration in VA-DTAiΔPC mice treated with Fc (Fc; n=6) or ABTAA (AB; n=6). Boxed regions (dotted-lines) are magnified and presented in panels in the corner. Error bars represent mean±s.d. ** P<0.01 versus Fc by Mann–Whitney U test. All scale bars, 500 μm (yellow). (d) Schematic diagrams depicting how inadequate pericyte coverage disintegrates BRB. In growing retinal vessels of neonates, proper pericyte recruitment through controlled PDGF-B/PDGFRβ signalling stabilizes ECs by activating the Tie2/Tie1-PI3 kinase-Akt signalling cascade, which leads to phosphorylation (P) and degradation of FOXO1 in ECs and promotes EC-pericyte interaction during BRB formation. Inadequate pericyte recruitment due to PDGFRβ signalling inhibition attenuates Tie2/Tie1-PI3 kinase-Akt signalling, which activates FOXO1-mediated transcription of Ang2, VEGFR2 and ESM1 in ECs. In stable retinal vessels of adult, several key factors including Tie2/Tie1- and shear stress-mediated activation of PI3 kinase-Akt signalling play key roles in maintenance of BRB integrity. Pericyte loss increases Ang2 and sensitivity to external noxious stimuli such as VEGF-A, leading to attenuated PI3 kinase-Akt signalling and enhanced FOXO1-mediated transcription of vascular destabilizing factors. In both cases with inadequate pericyte coverage around retinal vessels, increased Ang2 and Tie1 cleavage and reduced Tie2 further attenuated PI3 kinase-Akt signalling, leading to enhanced FOXO1-mediated transcription of vascular destabilizing factors in a positive feedback manner. These exacerbating processes eventually trigger further disintegration of BRB, manifesting DR phenotypes and accelerating DR progression.

Comment in

  • Role of pericytes in the retina.
    Santos GSP, Prazeres PHDM, Mintz A, Birbrair A. Santos GSP, et al. Eye (Lond). 2018 Mar;32(3):483-486. doi: 10.1038/eye.2017.220. Epub 2017 Nov 10. Eye (Lond). 2018. PMID: 29125148 Free PMC article. No abstract available.

References

    1. Cunha-Vaz J., Bernardes R. & Lobo C. Blood-retinal barrier. Eur. J. Ophthalmol. 21, S3–S9 (2011). - PubMed
    1. Campochiaro P. A. Molecular pathogenesis of retinal and choroidal vascular diseases. Prog. Retin. Eye Res. 49, 67–81 (2015). - PMC - PubMed
    1. Bergers G. & Song S. The role of pericytes in blood-vessel formation and maintenance. Neuro Oncol. 7, 452–464 (2005). - PMC - PubMed
    1. Potente M., Gerhardt H. & Carmeliet P. Basic and therapeutic aspects of angiogenesis. Cell 146, 873–887 (2011). - PubMed
    1. Hamilton N. B., Attwell D. & Hall C. N. Pericyte-mediated regulation of capillary diameter: a component of neurovascular coupling in health and disease. Front. Neuroenergetics 2, 1–14 (2010). - PMC - PubMed

Publication types

MeSH terms

Substances