. 2017 May 16:8:15040.
doi: 10.1038/ncomms15040.

Joint morphogenetic cells in the adult mammalian synovium

Affiliations

Joint morphogenetic cells in the adult mammalian synovium

Anke J Roelofs et al. Nat Commun. .

Abstract

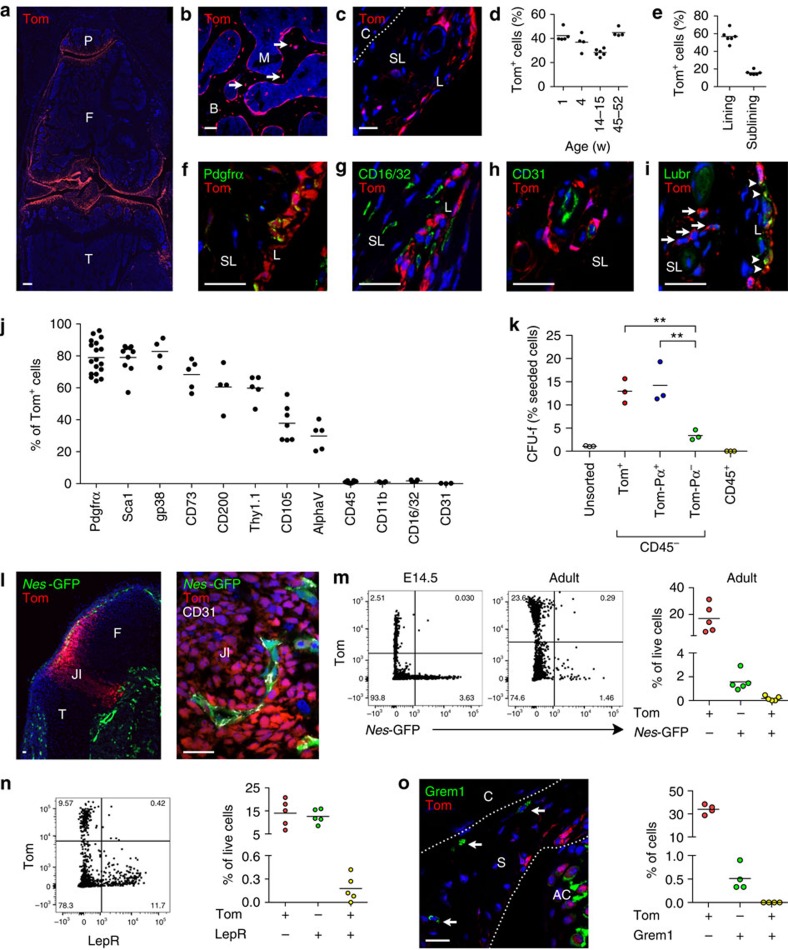
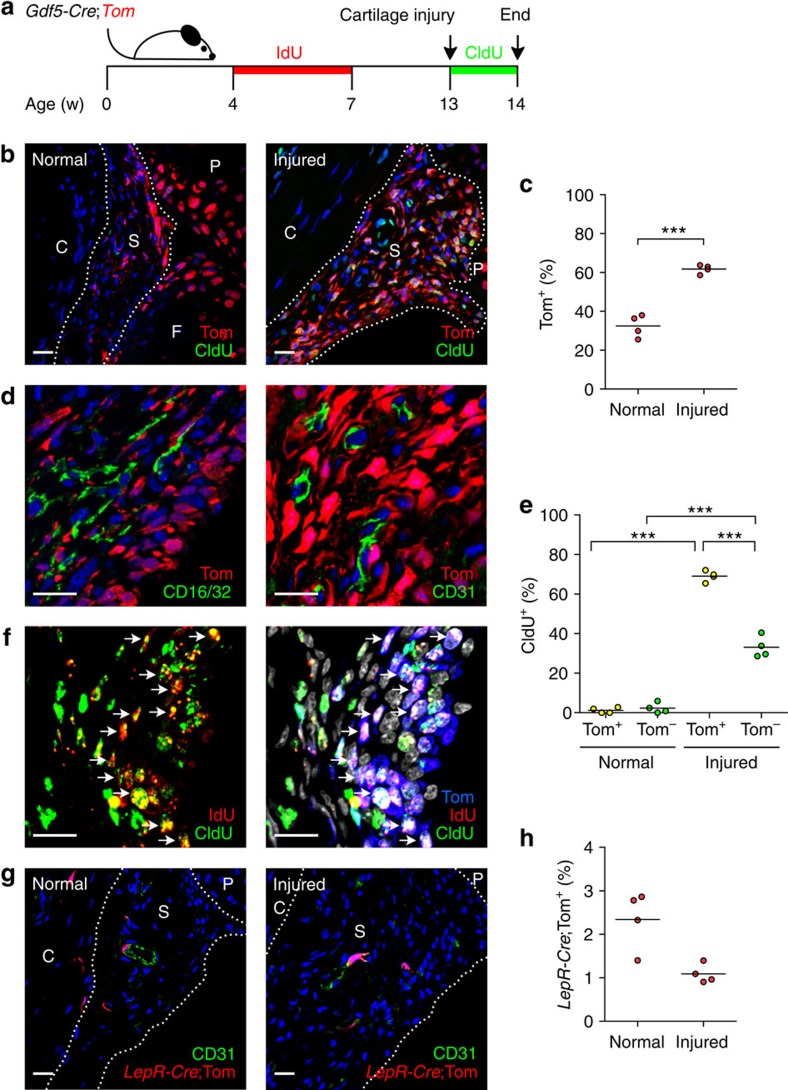
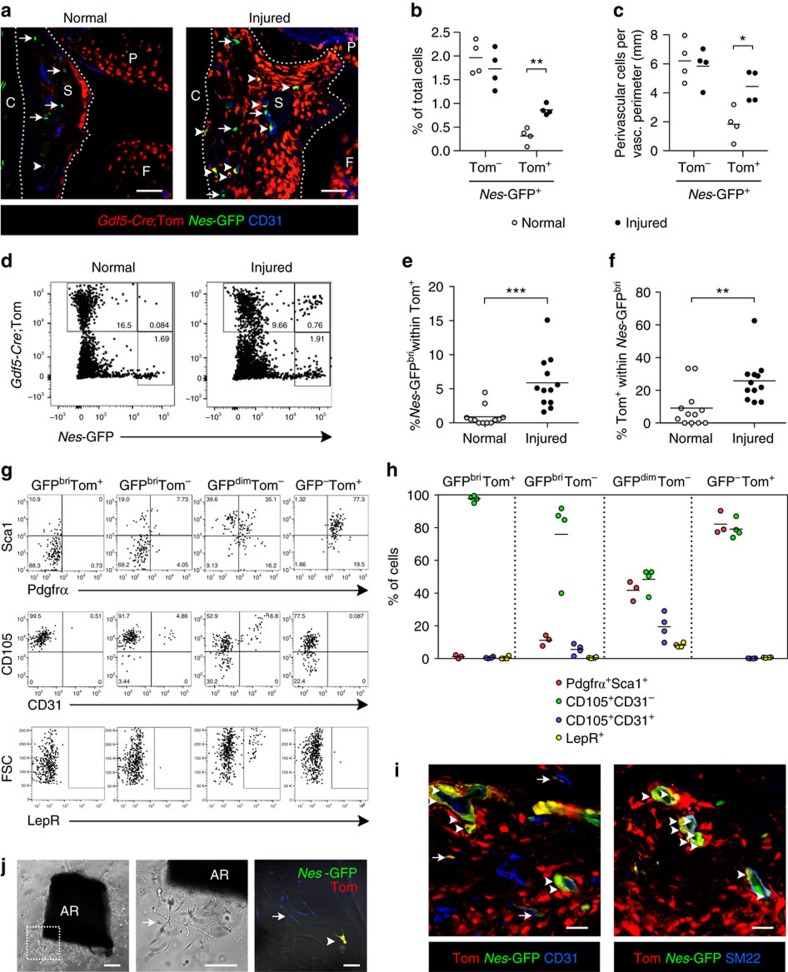
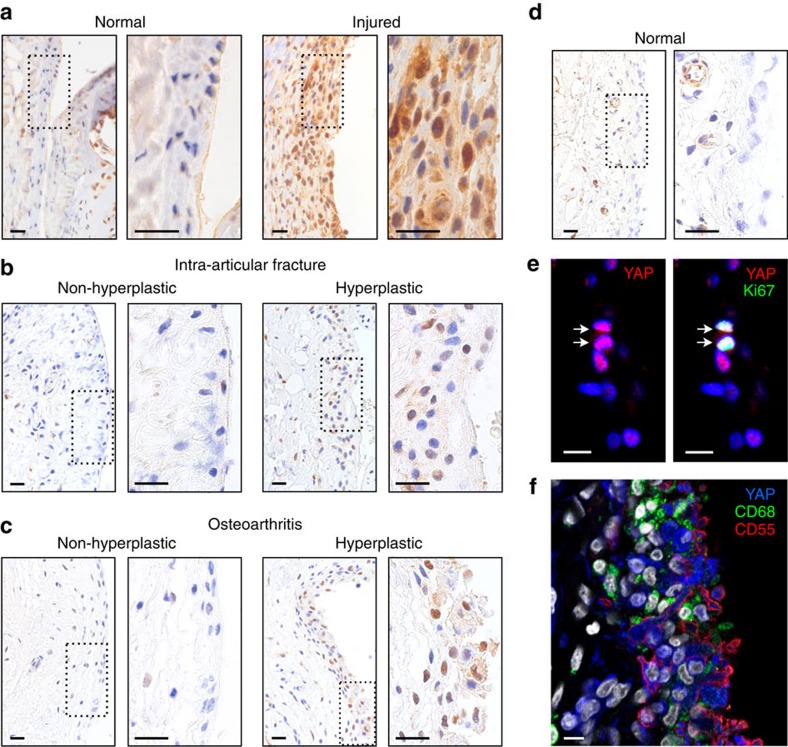
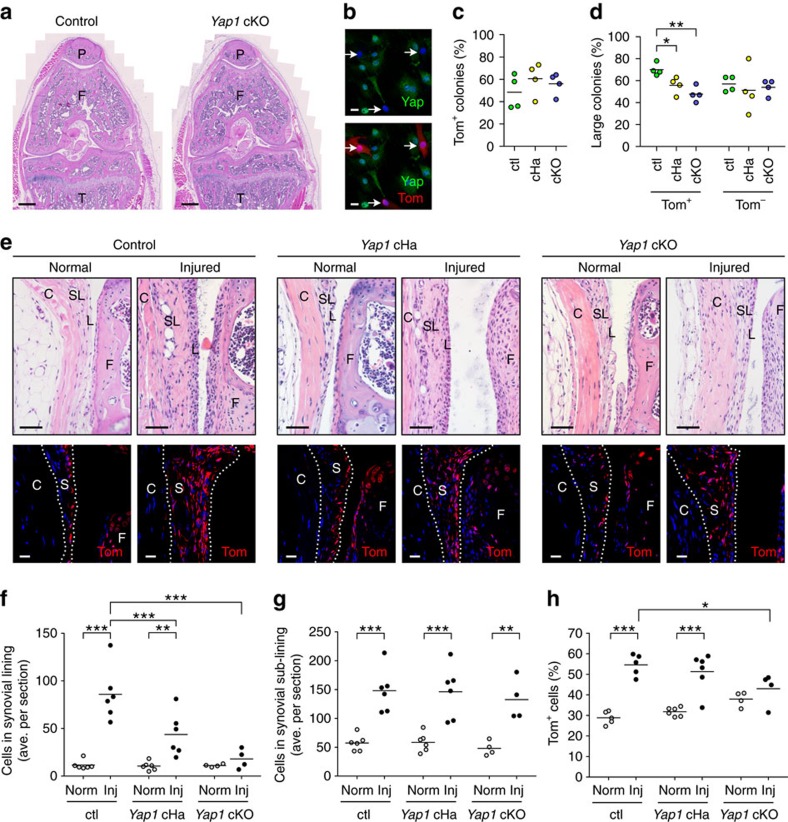
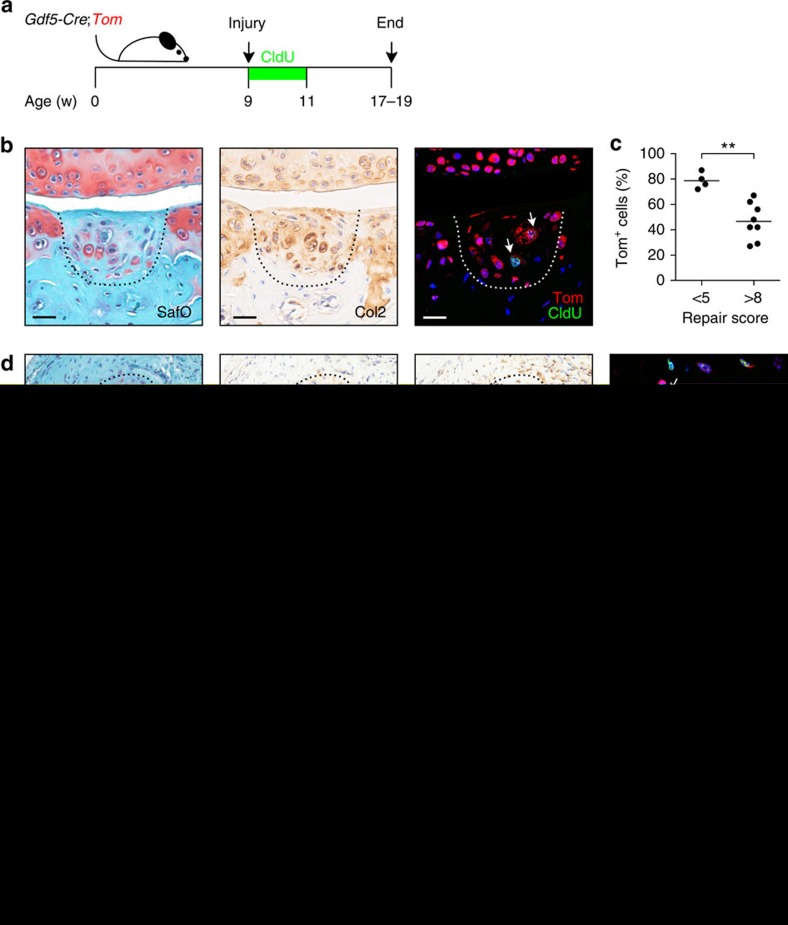
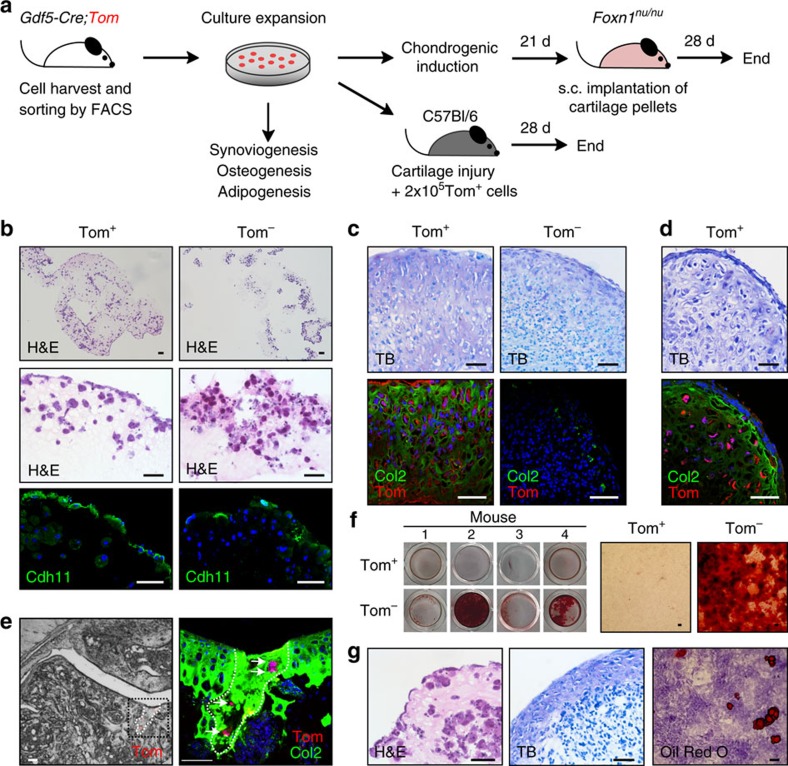
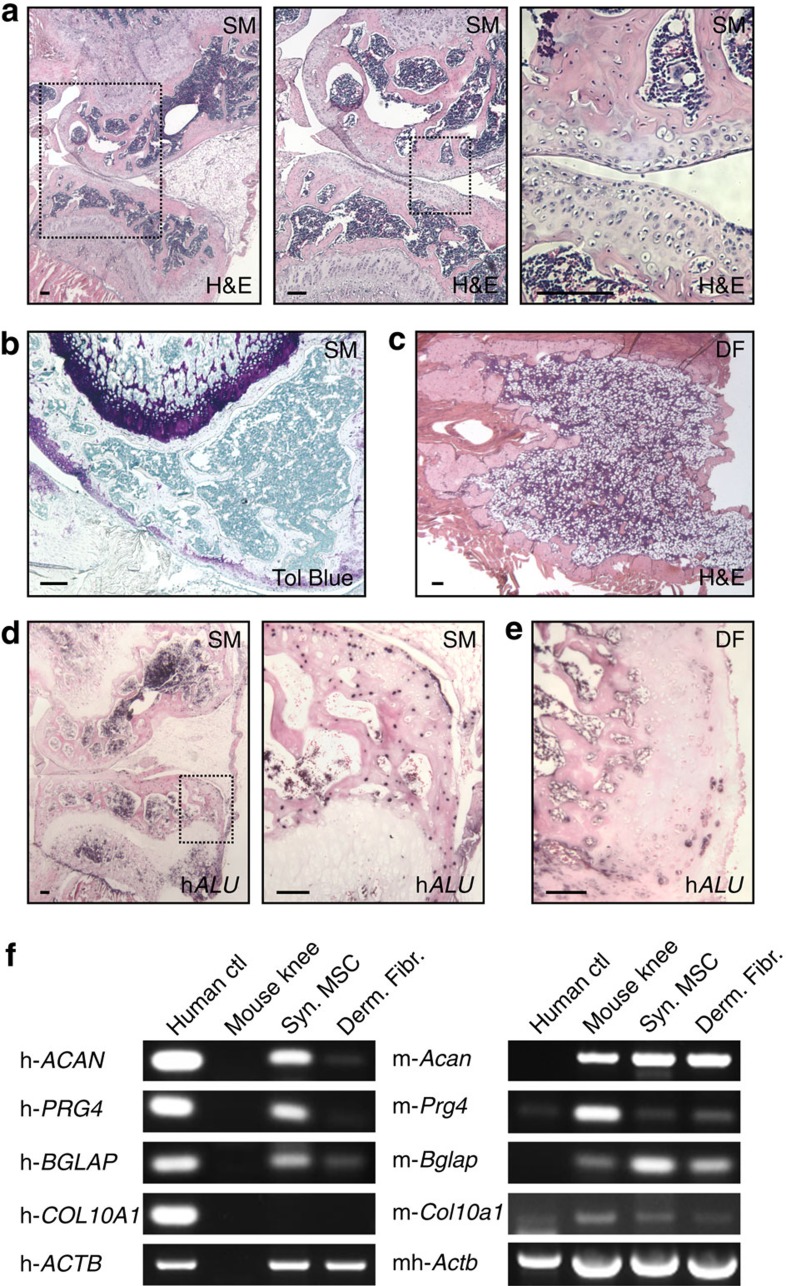
The stem cells that safeguard synovial joints in adulthood are undefined. Studies on mesenchymal stromal/stem cells (MSCs) have mainly focused on bone marrow. Here we show that lineage tracing of Gdf5-expressing joint interzone cells identifies in adult mouse synovium an MSC population largely negative for the skeletal stem cell markers Nestin-GFP, Leptin receptor and Gremlin1. Following cartilage injury, Gdf5-lineage cells underpin synovial hyperplasia through proliferation, are recruited to a Nestin-GFPhigh perivascular population, and contribute to cartilage repair. The transcriptional co-factor Yap is upregulated after injury, and its conditional ablation in Gdf5-lineage cells prevents synovial lining hyperplasia and decreases contribution of Gdf5-lineage cells to cartilage repair. Cultured Gdf5-lineage cells exhibit progenitor activity for stable chondrocytes and are able to self-organize three-dimensionally to form a synovial lining-like layer. Finally, human synovial MSCs transduced with Bmp7 display morphogenetic properties by patterning a joint-like organ in vivo. Our findings further the understanding of the skeletal stem/progenitor cells in adult life.


Conflict of interest statement

The authors declare no competing financial interests.

Figures

Figure 1
Figure 1. Gdf5-lineage cells in the mouse knee.
(ac) Tom fluorescence (red) in adult Gdf5-Cre;Tom mice showing (a) low magnification overview of knee (n=3), (b) epiphyseal bone with arrows indicating Tom+ osteocytes (n=3), (c) synovium (n=6). Nuclei were counterstained with DAPI (blue). (d,e) Tom+ cells in (d) synovium at different ages (n=4-6), and (e) adult synovial lining and sub-lining (n=6), as percentage of DAPI+ cells. (fi) Tom+ cells (red) in synovium (f) express the MSC/fibroblast marker Pdgfrα (green; n=4), are distinct from (g) CD16/CD32+ (green) macrophages (n=4) and (h) CD31+ (green) endothelial cells (n=3), and (i) express lubricin (Lubr; green) in lining (arrowheads) but not sub-lining (arrows) (n=4). Nuclei were counterstained with DAPI (blue). (j) Cell surface phenotype determined by flow cytometry (n=3–18; pooled data from seven experiments). See also Supplementary Fig. 2. (k) CFU-f activity of cells sorted by FACS. Colonies of ≥32 cells (≥5 population doublings) were counted (see also Supplementary Fig. 3). Tom+ and Tom-Pdgfrα+ populations were enriched for CFU-f activity (**P<0.01; n=3; one-way ANOVA with Bonferroni post-test). (l) Tom (red) and GFP (green) fluorescence in hindlimb from Gdf5-Cre;Tom;Nes-GFP E14.5 embryo (n=4), showing Nes-GFP+ cells associated with CD31 staining (white) distinct from Tom+ JI cells. Nuclei were counterstained with DAPI (blue). (m) Flow cytometry showing limited overlap between Nes-GFP+ cells and Tom+ Gdf5 lineage in E14.5 hindlimb (n=3) and adult knee synovium of Gdf5-Cre;Tom;Nes-GFP mice (n=5). (n) LepR expression detected using a pan-LepR antibody showing very few LepR+ cells within the Tom+ Gdf5 lineage (n=5). (o) Grem1 (green) and Tom (red) expression in adult Gdf5-Cre;Tom mouse synovium (n=4) detected by IF staining failing to show overlap. Nuclei were counterstained with DAPI (blue). P, patella; F, femur; T, tibia; S, synovium; L, synovial lining; SL, synovial sub-lining; C, capsule; B, bone; M, marrow; AC, articular cartilage; JI, joint interzone. Scale bars, 200 μm (a) and 20 μm (b,c,fi,l,o).
Figure 2
Figure 2. Contribution of Gdf5 lineage to synovial hyperplasia after cartilage injury.
(a) Schematic experimental design for data in bf. (b) IF staining for Tom (red) and CldU (green) in control and injured knee synovium. Nuclei were counterstained with DAPI (blue). (c) Tom+ cells, as percentage of total cells in synovium as shown in b, increased after injury (***P<0.0001; n=4; Student's t-test). (d) Tom+ (red) cells in injured knee synovium negative for the haematopoietic marker CD16/CD32 (green; n=3; image on left) and endothelial marker CD31 (green; n=4; image on right). Nuclei were counterstained with DAPI (blue). (e) CldU-labelling showing higher rate of proliferation in Tom+ compared to Tom cells after injury (***P<0.0001; n=4; two-way ANOVA with Bonferroni post-test). (f) IF staining for IdU (red), CldU (green) and Tom (blue) in injured knee synovium (n=3). Nuclei were counterstained with DAPI (grey). Left: IdU and CldU overlaid; right: all channels overlaid. Arrows indicate triple-labelled cells. (g) Tom+ (red) cells in control and injured knee synovium of adult LepR-Cre;Tom mice (n=4) with CD31 in green. Nuclei were counterstained with DAPI (blue). (h) Tom+ cells in synovium as percentage of total cells. Dashed lines, synovial boundary; S, synovium; P, patella; F, femur; C, capsule. Scale bars, 20 μm. Data in b,c,e are representative of two experiments.
Figure 3
Figure 3. Gdf5-lineage recruitment into a Nes-GFPbright perivascular population in response to injury.
(a) Tom+ Gdf5-lineage (red) and Nes-GFP+ cells (green) in control and injured knee synovium from adult Gdf5-Cre;Tom;Nes-GFP mice with CD31 in blue (n=4). Arrows, Nes-GFP+ cells; arrowheads, Tom+Nes-GFP+ cells; dashed lines, synovial boundary; S, synovium; C, capsule; P, patella; F, femur. Scale bars, 50 μm. (b) Percentage of cells in synovium that were Tom+Nes-GFP+ increased after injury (**P=0.0016; n=4; Student's t-test). (c) Tom+Nes-GFP+ perivascular cell number increased relative to the vasculature after injury (see also Supplementary Fig. 5a–c) (*P=0.0154; n=4; Student's t-test). (d) Double-labelled cells in injured knee synovium were mostly Nes-GFPbright. Equal total number of events is shown. (e,f) Tom+Nes-GFPbright cells, quantified from d, increased after injury as percentage of (e) total Tom+ (***P=0.0002; n=12; Mann–Whitney test; pooled data from three experiments) and (f) total Nes-GFPbright cells (**P=0.0060; n=12; Mann–Whitney test; pooled data from three experiments). (g) Phenotypic analysis of labelled cells from injured knees showing similarity between Tom+Nes-GFPbright and Tom-Nes-GFPbright populations. For each population, equal number of events is shown. FSC, forward scatter. (h) Percentage of cells within the indicated populations that were positive for the indicated marker(s) (n=3–4; data from two experiments). (i) Adjacent histological sections stained with CD31 (blue; left) or SM22 (blue; right) showing Tom+ (red) and Nes-GFP+ (green) double-positive cells (appearing yellow) in injured knee synovium localizing predominantly around arterioles and expressing the smooth muscle marker SM22 (arrowheads) with some Tom+Nes-GFP+ cells found around other CD31+ vessels (arrows) (n=4). Nuclei were counterstained with DAPI (blue). Scale bars, 20 μm. See also Supplementary Fig. 5d. (j) Mouse AR co-cultured with Tom+ synovial cells from Gdf5-Cre;Tom;Nes-GFP mouse showing Tom+ (red) and Nes-GFP+ (green) double-positive cell (appearing yellow; arrowhead) in close proximity to endothelial tubules (arrow). Nuclei were counterstained with DAPI (blue). n=8 replicate AR co-cultures. Left, middle: Phase-contrast only; box on left indicates region shown at higher magnification in middle. Scale bars, 200 μm. Right: Phase-contrast with fluorescence overlaid. Scale bar, 50 μm.
Figure 4
Figure 4. Yap is upregulated in the synovium of mice after injury and expressed in hyperplastic lining of human synovium.
(a) Yap (brown) expression in synovium of mice 4 days after cartilage injury (n=4). Nuclei were counterstained with haematoxylin (blue). Boxed area on left is shown at higher magnification on right. Scale bars, 20 μm. (bf) YAP expression in human synovium from (b) intra-articular fracture patients (n=3 donors), (c,e,f) osteoarthritis patients (n=7 donors) and (d) normal knee synovium (n=1 donor). (bd) IHC for YAP (brown) showing hyperplastic versus non-hyperplastic lining analysed within the same histological sections. Nuclei were counterstained with haematoxylin (blue). Boxed area on left is shown at higher magnification on right. Scale bars, 20 μm. (e) IF staining for YAP (red) and Ki67 (green). Nuclei were counterstained with DAPI (blue). Arrows indicate double-positive cells. Scale bars, 10 μm. (f) IF staining for YAP (blue) together with CD55 (red) marking synovial lining fibroblasts and CD68 (green) marking macrophages. Nuclei were counterstained with DAPI (grey). Scale bar, 10 μm.
Figure 5
Figure 5. Conditional knockout of Yap1 in Gdf5-lineage cells prevents synovial lining hyperplasia after cartilage injury.
(a) H&E-stained sections of knees from an adult Gdf5-Cre;Yap1fl/fl;Tom (Yap1 cKO) mouse and littermate control. P, patella; F, femur; T, tibia. Scale bars, 500 μm. (b) Lack of Yap (green) expression by Tom+ (red) synovial cells from adult Yap1 cKO mice (arrows) indicating successful Cre-mediated Yap1 KO in Gdf5-lineage cells (n=3). Nuclei were counterstained with DAPI (blue). Scale bars, 20 μm. (c,d) CFU-f activity of synovial cells isolated from control (ctl), Yap1 haploinsufficient Gdf5-Cre;Yap1fl/WT;Tom (Yap1 cHa) and Yap1 cKO mice showing (c) percentage of colonies (≥8 cells, that is, ≥3 population doublings) that were Tom+, and (d) percentage of Tom+ colonies that were large (≥64 cells, that is, ≥6 population doublings) in ctl, Yap1 cHa and Yap1 cKO cultures (*P<0.05; **P<0.01; n=4; one-way ANOVA with Bonferroni post-test). (e) Normal and injured knee synovium of ctl, Yap1 cHa and Yap1 cKO mice 6 days after cartilage injury. Top: H&E-stained sections. Bottom: Tom-stained (red) sections with DAPI (blue) counterstain. S, synovium; L, synovial lining; SL, synovial sub-lining; C, capsule; F, femur. Scale bars, 50 μm (H&E images) and 20 μm (fluorescent images). (f,g) Average number of cells per section in the synovial lining (f), and sub-lining (g), quantified from H&E images as in e, showing decreased cellularity in synovial lining but not sub-lining of injured cHa and cKO mice compared to ctl mice (**P<0.01; ***P<0.001; n=4–6; two-way ANOVA with Bonferroni post-test). (h) Yap1 cKO mice showed diminished expansion of Tom+ Gdf5-lineage cells in synovium after cartilage injury (*P<0.05; ***P<0.001; n=4–6; two-way ANOVA with Bonferroni post-test).
Figure 6
Figure 6. Contribution of Gdf5-lineage cells to cartilage formation and repair after joint surface injury.
(a) Schematic experimental design for data in (bd). (b) Tom+ cells in the articular cartilage repair tissue (indicated by dashed lines). Adjacent sections show (from left to right) safranin O/fast green (Saf O), Col2 (brown, with haematoxylin counterstain in blue), or Tom (red) and the proliferation marker CldU (green) with DAPI counterstain (blue). (c) Percentage of Tom+ cells in the cartilage repair tissue in knee joints with low (that is, good, n=4) and high (that is, poor, n=8) repair scores (**P=0.0020; Student's t-test; pooled data from two experiments). (d) Tom+ cells in ectopic cartilage-like tissue in synovium (indicated by dashed lines). Adjacent sections show (from left to right) Saf O, Col2 (brown, with haematoxylin counterstain in blue), Tom (brown, with haematoxylin counterstain in blue), or Tom (red) and CldU (green) with DAPI counterstain (blue). Arrows: Tom+CldU+ cells. Seven areas of ectopic cartilage in 4 mice were analysed. (e) Schematic experimental design for data in (fh). (f) Fewer Gdf5-lineage cells were found in the repair tissue of Yap1 cKO compared to Yap1 cHa mice (*P=0.0282; n=3-4; Student's t-test). (g,h) Areas of joint surface repair largely devoid of Tom+ cells (g), or containing Tom+ chondrocyte-like cells (h) were both observed in Yap1 cKO mice. Left: Saf O; right: Tom (red) with DAPI counterstain (blue). Scale bars in all panels: 20 μm.
Figure 7
Figure 7. Cell patterning and differentiation capacity of culture-expanded Gdf5-lineage cells.
(a) Schematic experimental overview. (b) Tom+ cells (n=4 donor mice), but not Tom cells (n=3 donor mice), formed a synovial-like structure with elongated, flattened cells at the matrix-media interface staining for Cdh11. Top and middle: H&E-stained sections; bottom: IF staining for Cdh11 (green) with DAPI counterstain (blue). (c,d) Cartilage pellets of (c) Tom+ and Tom cells after in vitro chondrogenic induction (six pellets of cells from three donor mice) and (d) Tom+ cells after explant from nude mice (seven pellets of cells from three donor mice; pooled data from two experiments). Top: TB staining. Bottom: Col2 (green) and Tom (red) IF, with DAPI counterstain in blue. Tom+ cells gave rise to a matrix that stained for TB and Col2, resistant to in vivo remodelling. (e) Contribution of transplanted Tom+ cells to cartilage repair in non-healer C57Bl/6 mice (n=11). Left: Cryosection showing Tom+ (red) cells at the cartilage defect. Right: Higher magnification of black-boxed area on left after immunostaining for Col2 (green) with DAPI counterstain (blue). Shown is an overlay of two confocal images at different z positions. Dashed line, outline of injury. (f) Tom+ cells (n=4 donor mice) failed to show osteogenesis by Alizarin Red S staining; microscopy images shown on right. Data are from four experiments. (g) Single-Tom+-cell-derived clonal population showing tripotency to FLS (left), chondrocytes (middle) and adipocytes (right). Three clonal cell populations were analysed. Scale bars, 50 μm.
Figure 8
Figure 8. Joint morphogenetic properties of adult human synovial MSCs.
(a,b,d,f) Human synovial MSCs (n=1) transduced with Ad-Bmp7 and injected into nude mouse thigh formed a joint-like structure upon explant 4 weeks later, while (c,e,f) dermal fibroblasts (n=1) transduced with Ad-Bmp7 gave rise to an ossicle. (d,e) ISH for human-specific ALU genomic repeats. Black dots indicate human nuclei. Scale bars, 100 μm. Boxed areas on left shown at higher magnification on right. SM: synovial MSCs; DF: dermal fibroblasts; H&E: haematoxylin and eosin; Tol blue: toluidine blue; hALU: human ALU repeats. (f) RT–PCR analysis using species-specific primers. Human positive controls (human ctl) were freshly isolated chondrocytes from articular cartilage for ACAN (aggrecan) and PRG4 (lubricin), MSCs treated with vitamin D3 for BGLAP (osteocalcin), and bone marrow MSCs treated with TGFβ1 in pellet culture for COL10A1 (collagen type X); a mouse knee joint was used as mouse ctl for all genes. h: primer pair specific for human; m: primer pair specific for mouse; mh: primer pair detects both mouse and human. Samples were equalized for h-ACTB (h-β-actin; human ctl used for h-ACAN and h-PRG4 is shown), or for mh-Actb in the case of the mouse ctl. See also Supplementary Fig. 9.

Comment in

References

    1. De Bari C., Dell'Accio F., Tylzanowski P. & Luyten F. P. Multipotent mesenchymal stem cells from adult human synovial membrane. Arthritis Rheumatol. 44, 1928–1942 (2001). - PubMed
    1. De Bari C. et al.. Skeletal muscle repair by adult human mesenchymal stem cells from synovial membrane. J. Cell Biol. 160, 909–918 (2003). - PMC - PubMed
    1. Pittenger M. F. et al.. Multilineage potential of adult human mesenchymal stem cells. Science 284, 143–147 (1999). - PubMed
    1. Morikawa S. et al.. Prospective identification, isolation, and systemic transplantation of multipotent mesenchymal stem cells in murine bone marrow. J. Exp. Med. 206, 2483–2496 (2009). - PMC - PubMed
    1. Park D. et al.. Endogenous bone marrow MSCs are dynamic, fate-restricted participants in bone maintenance and regeneration. Cell Stem Cell 10, 259–272 (2012). - PMC - PubMed

Publication types

MeSH terms