. 2017 Jun;30(2):81-94.
doi: 10.1007/s00497-017-0301-6. Epub 2017 May 16.

Untargeted metabolomic analysis of tomato pollen development and heat stress response

Affiliations

Untargeted metabolomic analysis of tomato pollen development and heat stress response

Marine J Paupière et al. Plant Reprod. 2017 Jun.

Abstract

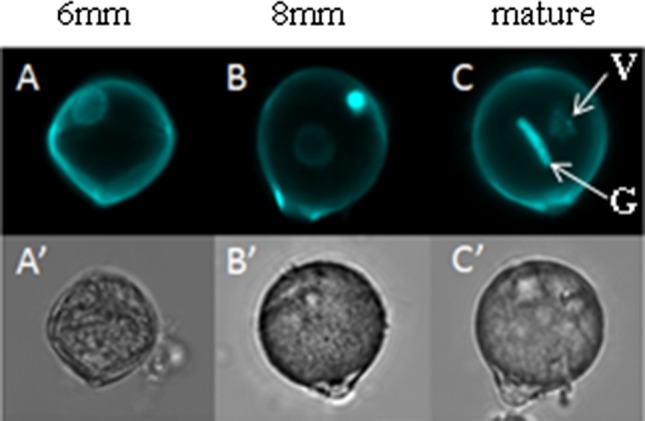
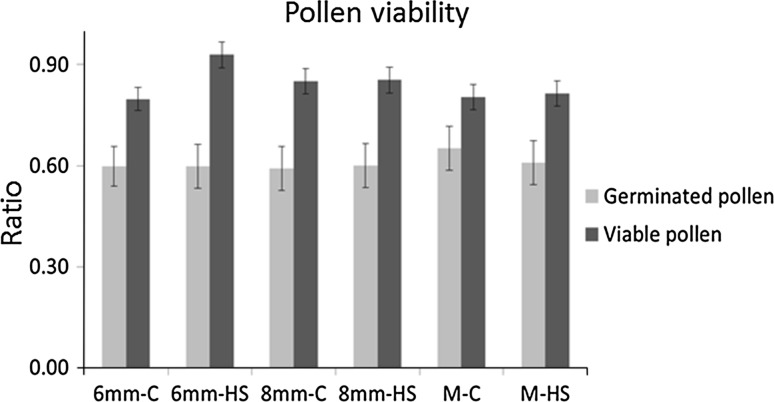
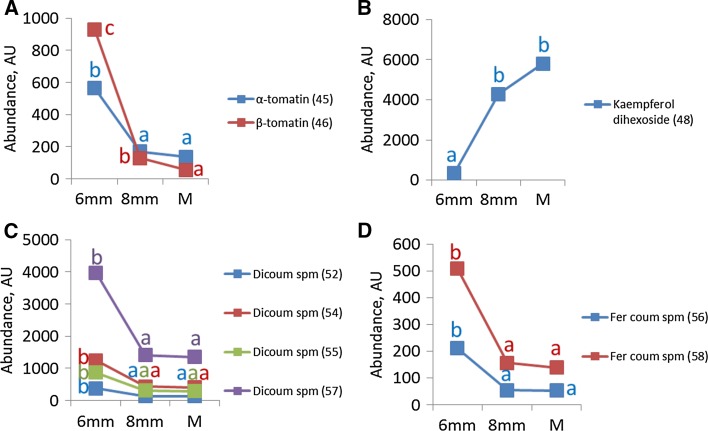
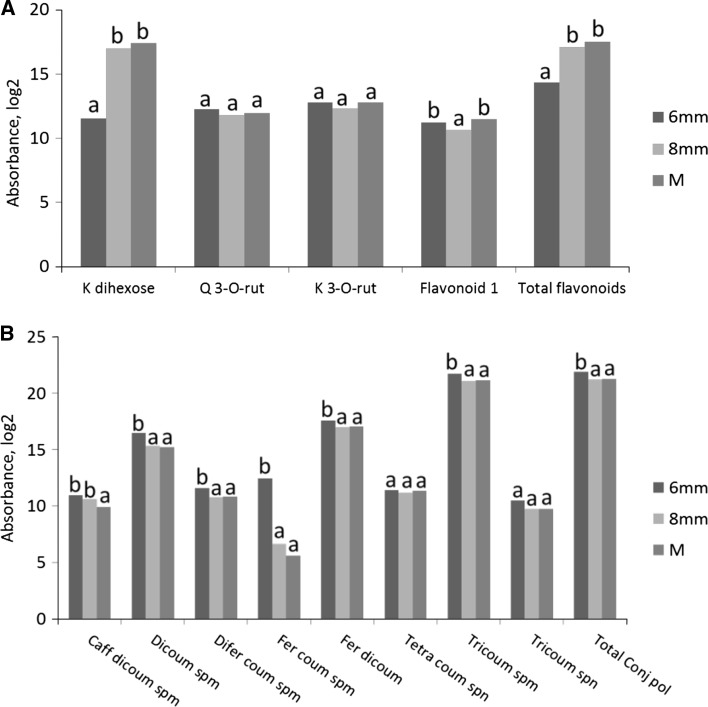
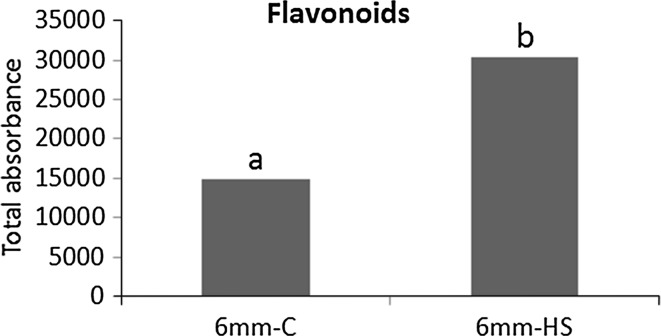
Pollen development metabolomics. Developing pollen is among the plant structures most sensitive to high temperatures, and a decrease in pollen viability is often associated with an alteration of metabolite content. Most of the metabolic studies of pollen have focused on a specific group of compounds, which limits the identification of physiologically important metabolites. To get a better insight into pollen development and the pollen heat stress response, we used a liquid chromatography-mass spectrometry platform to detect secondary metabolites in pollen of tomato (Solanum lycopersicum L.) at three developmental stages under control conditions and after a short heat stress at 38 °C. Under control conditions, the young microspores accumulated a large amount of alkaloids and polyamines, whereas the mature pollen strongly accumulated flavonoids. The heat stress treatment led to accumulation of flavonoids in the microspore. The biological role of the detected metabolites is discussed. This study provides the first untargeted metabolomic analysis of developing pollen under a changing environment that can serve as reference for further studies.

Keywords: Heat stress; High temperature; Metabolomics; Pollen development; Untargeted analysis.


Conflict of interest statement

The authors declare no conflict of interest.

Figures

Fig. 1
Fig. 1
Pollen development of S. lycopersicum Micro-Tom cv. Pollen of polarized microspore stage is represented in (A)–(A′); pollen of early bicellular stage is represented in (B)–(B′); pollen of mature pollen stage with a vegetative nucleus (V) and a generative nucleus (G) is represented in (C)–(C′). Sizes of the anther are indicated above the pictures. AC fluorescence microscopy after DAPI staining to visualize the nucleus; A′–C′ light microscopy
Fig. 2
Fig. 2
Pollen viability under control and heat stress treatments. 6 mm, polarized microspore; 8 mm, early bicellular pollen; M mature pollen, C control condition, HS heat stress treatment. No statistically significant differences were found between control and heat stress treatments for each of the developmental stages (Tukey test, p value <0.05). Bars represent the standard error of the mean
Fig. 3
Fig. 3
Principal component analysis (PCA) of secondary metabolism. The PCA of the samples is represented in (a) with light green dots for 6 mm control (C) sample, dark green dots for 6 mm heat stress (HS) sample, light blue dots for 8 mm-C, dark blue dots for 8 mm-HS, light pink dots for M–C, and red dots for M–HS. Component 1 (C1), component 2 (C2) and component 3 (C3) explain 74.8, 10.3 and 4.3% of the observed variation, respectively. The metabolites responsible for the variation among the samples are represented in (b) with grey dots for unknown compounds, red dots for alkaloids, yellow dots for conjugated polyamines and green dots for flavonoids. 46, beta-tomatine; 47, tomatine and 48 kaempferol dihexoside. The PCA was performed on log2 transformed and mean centred values
Fig. 4
Fig. 4
Secondary metabolite profiles during pollen development under control condition. The values per stage represent the average value per stage of both control and heat conditions. Only metabolites showing statistically significant differences between the developmental stages are represented. Abundances of alkaloids are represented in (a), flavonoids in (b), dicoumaroyl spermidine isomers in (c) and caffeoyl dicoumaroyl spermidine isomers in (d). 6 mm, polarized microspore; 8 mm, early bicellular pollen; M mature pollen, C control condition, Dicoum dicoumaroyl, Sperm spermidine, Fer feruloyl. Letters show statistically significant differences between the developmental stages per metabolite. Similar letters per metabolite indicate that there was no significant difference between the stages. Differences were considered statistically significant when the p value of the ANOVA test was lower than 0.01, and the p value of the Bonferroni post hoc test was lower than 0.05
Fig. 5
Fig. 5
Absorbance profiles of secondary metabolites during pollen development under control condition. The values per stage represent the average value per stage of both control and heat conditions. The absorbance of flavonoids detected using photodiode array (PDA) at 340 ± 15 nm is represented in (a). The abundance of polyamines detected by PDA at 260 ± 15 nm is represented in (b). Isomers of each conjugated polyamine were summed up to represent the total abundance of each conjugated form. 6 mm, polarized microspore; 8 mm, early bicellular pollen; M mature pollen, C control condition, K kaempferol, Q quercetin, rut rutinoside, coum coumaroyl, caff caffeoyl, fer feruloyl, spm spermidine, spn spermine, total conj. Pol total conjugated polyamines. Letters show statistically significant differences between the developmental stages per metabolite. Similar letters per metabolite indicate that there was no significant difference between the stages. Differences were considered statistically significant when the p value of the ANOVA test was lower than 0.01, and the p value of the Bonferroni post hoc test was lower than 0.05
Fig. 6
Fig. 6
Total absorbance of flavonoids under control and heat stress treatments. The total abundance of flavonoids was determined by the sum of the photodiode array absorbance of individual flavonoids at 340 nm ± 15. Stars underline statistically significant differences between 6 mm-C and 6 mm-HS. Letters show statistically significant differences between the developmental stages per metabolite. Similar letters per metabolite indicate that there was no significant difference between the stages. Differences were considered statistically significant when the p value of the ANOVA test was lower than 0.01, and the p value of the Bonferroni post hoc test was lower than 0.05

References

    1. Aloisi I, Cai G, Serafini-Fracassini D, Del Duca S. Polyamines in pollen: from microsporogenesis to fertilization. Front Plant Sci. 2016 - PMC - PubMed
    1. Altman A, Levin N. Interactions of polyamines and nitrogen nutrition in plants. Physiol Plant. 1993;89:653–658. doi: 10.1111/j.1399-3054.1993.tb05229.x. - DOI
    1. Bagni N, Scaramagli S, Bueno M, Della Mea M, Torrigiani P (1994) Which is the active form of polyamines in plants? In: Caldarera CM, Clò C, Moruzzi MS (eds) Polyamines: biological and clinical aspects. CLUEB, Bologna, pp 131–137
    1. Bassard JE, Ullmann P, Bernier F, Werck-Reichhart D. Phenolamides: bridging polyamines to the phenolic metabolism. Phytochemistry. 2010;71:1808–1824. doi: 10.1016/j.phytochem.2010.08.003. - DOI - PubMed
    1. Bokszczanin KL, Solanaceae Pollen Thermotolerance Initial Training Network C. Fragkostefanakis S. Perspectives on deciphering mechanisms underlying plant heat stress response and thermotolerance. Front Plant Sci. 2013;4:315. doi: 10.3389/fpls.2013.00315. - DOI - PMC - PubMed

Publication types

LinkOut - more resources