. 2017 Sep;11(9):1975-1987.
doi: 10.1038/ismej.2017.62. Epub 2017 May 16.

Convergence of gut microbiotas in the adaptive radiations of African cichlid fishes

Affiliations

Convergence of gut microbiotas in the adaptive radiations of African cichlid fishes

Laura Baldo et al. ISME J. 2017 Sep.

Abstract

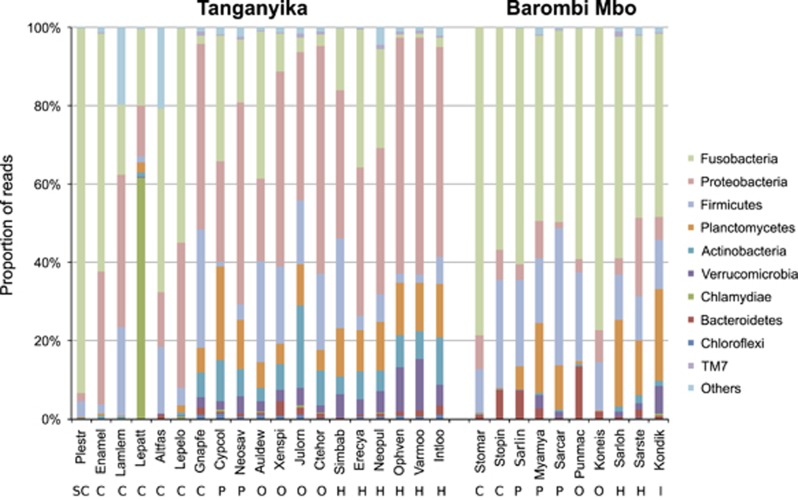
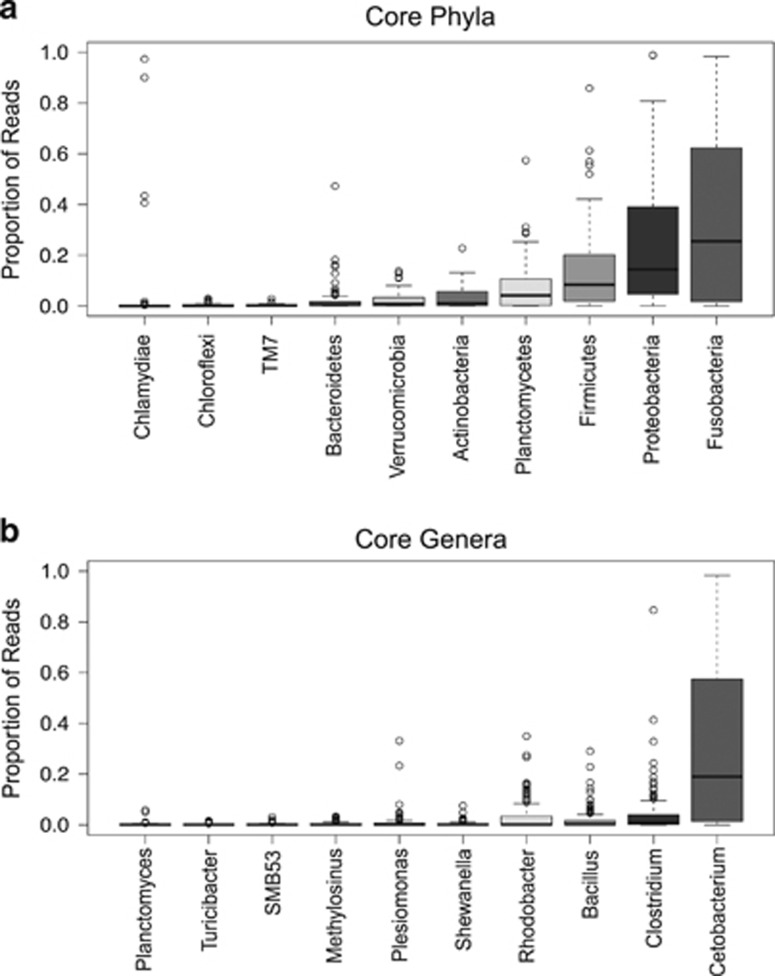
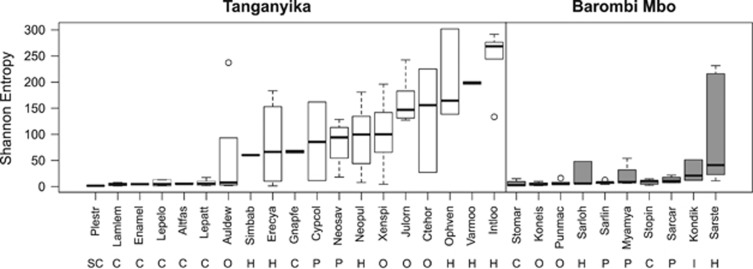
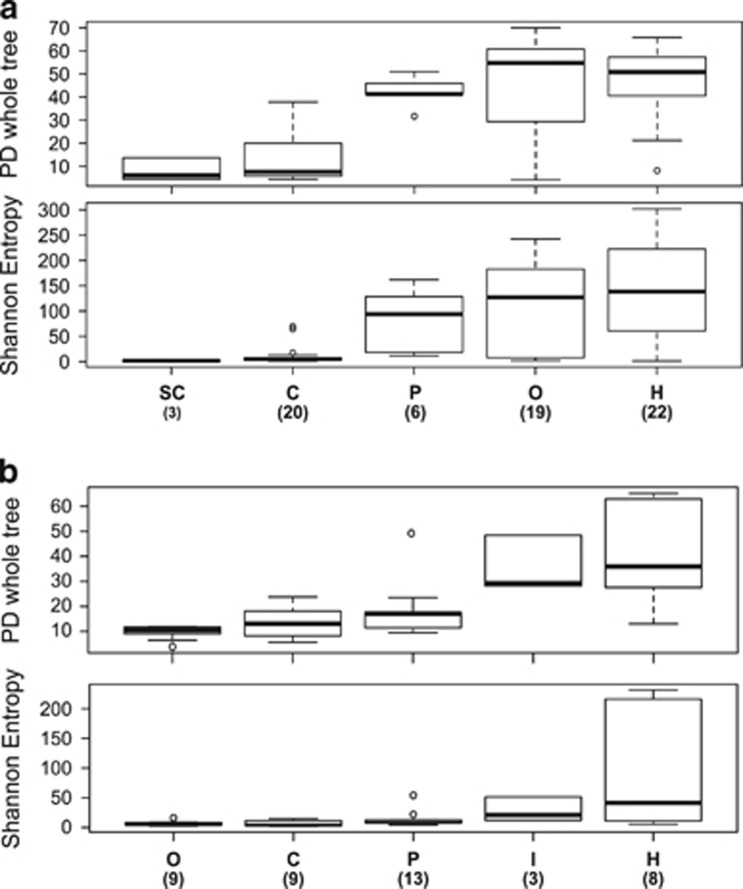
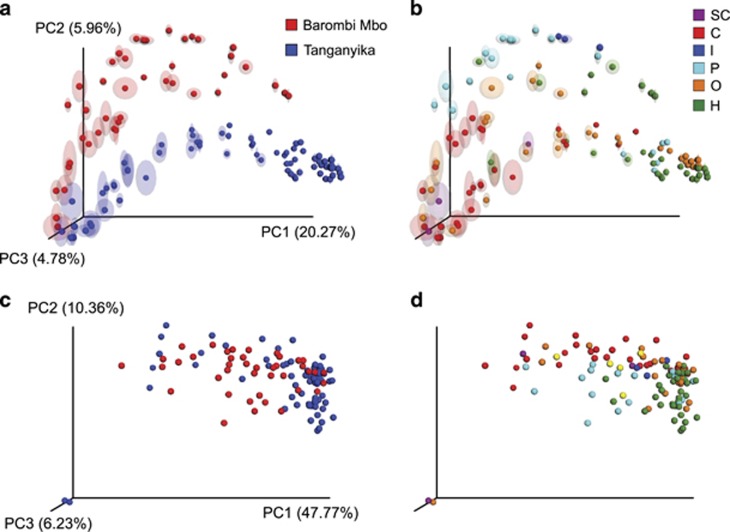
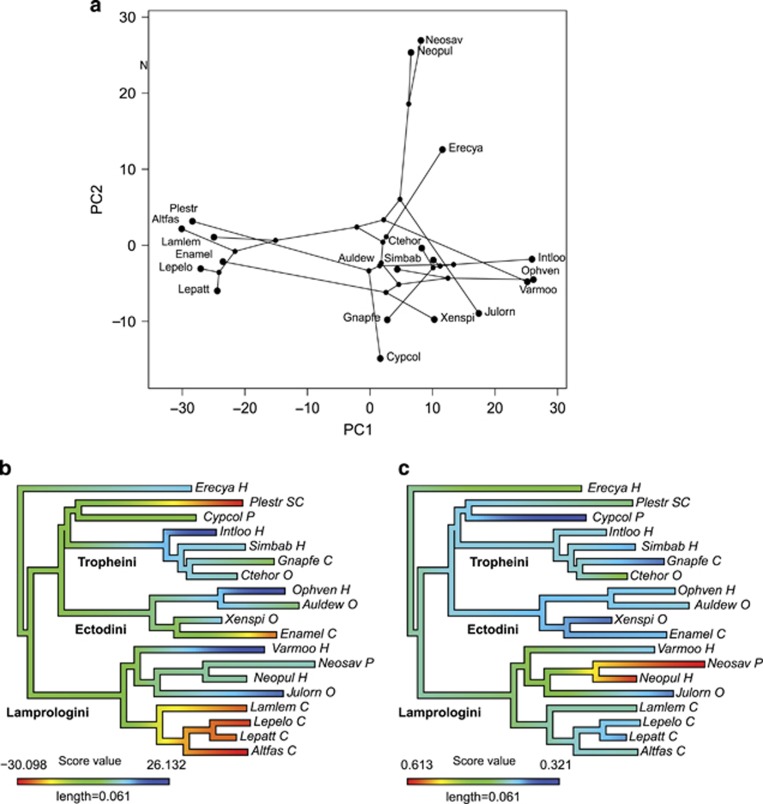
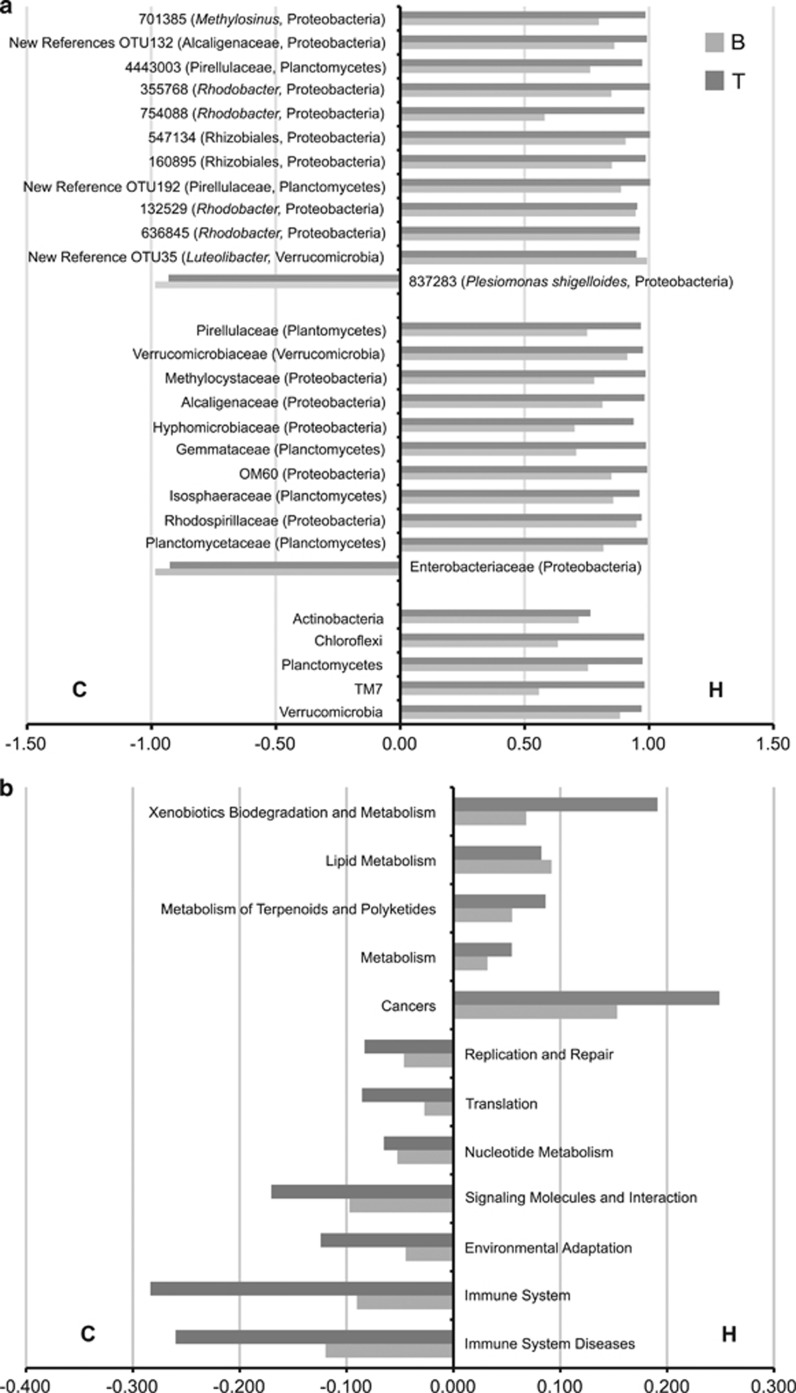
Ecoevolutionary dynamics of the gut microbiota at the macroscale level, that is, in across-species comparisons, are largely driven by ecological variables and host genotype. The repeated explosive radiations of African cichlid fishes in distinct lakes, following a dietary diversification in a context of reduced genetic diversity, provide a natural setup to explore convergence, divergence and repeatability in patterns of microbiota dynamics as a function of the host diet, phylogeny and environment. Here we characterized by 16S rRNA amplicon sequencing the gut microbiota of 29 cichlid species from two distinct lakes/radiations (Tanganyika and Barombi Mbo) and across a broad dietary and phylogenetic range. Within each lake, a significant deviation between a carnivorous and herbivorous lifestyle was found. Herbivore species were characterized by an increased bacterial taxonomic and functional diversity and converged in key compositional and functional community aspects. Despite a significant lake effect on the microbiota structure, this process has occurred with remarkable parallels in the two lakes. A metabolic signature most likely explains this trend, as indicated by a significant enrichment in herbivores/omnivores of bacterial taxa and functions associated with fiber degradation and detoxification of plant chemical compounds. Overall, compositional and functional aspects of the gut microbiota individually and altogether validate and predict main cichlid dietary habits, suggesting a fundamental role of gut bacteria in cichlid niche expansion and adaptation.


Conflict of interest statement

The authors declare no conflict of interest.

Figures

Figure 1
Figure 1
Taxonomic composition at the phylum level of wild cichlid gut microbiotas. Bars show proportions of taxa per cichlid species as average across conspecifics, estimated from the rarefied OTU table (13 730 reads). ‘Others’ group shows all phyla with relative abundance below 1% over the total number of reads. Approximate diet categories are shown below species names: SC, scale eaters; C, carnivores: P, planktivores; O, omnivores; H, herbivores; I, insect eaters (see Supplementary Table 1 and Information for diet details). Within each lake, sampling was carried out in close areas and in a few days time (less than a month) to minimize the effect of geographical and seasonal variables. Species names abbreviations: Plestr: Plecodus straeleni; Lamlem: Lamprologus lemairii; Lepelo: Lepidiolamprologus eolongatus; Lepatt: Lepidiolamprologus attenuatus; Altfas: Altolamprologus fasciatus; Enamel: Enantiopus melanogenys; Gnapfe: Gnathochromis pfefferi; Cypcol: Cyprichromis coloratus; Neosav: Neolamprologus savoryi; Audelw: Aulonochranus dewindtii; Ctehor: Ctenochormis horei; Julorn: Julidochromis ornatus; Xenspi: Xenotilapia spilotera; Varmoo: Variabilichromis moorii; Neopul: Neolamprologus pulcher; Intloo: Interochromis loockii; Ophven: Ophthalmotilapia ventralis; Erecya: Eretmodus cyanostictus; Simbab: Simochromis babaulti; Kondik: Konia dikume; Punmac: Pungu maclareni; Stomar: Stomatepia mariae; Stopin: Stomatepia pindu; Myamya: Myaka myaka; Sarcar: Sarotherodon caroli; Sarlin: Sarotherodon linnellii; Koneis: Konia eisentrauti; Sarloh: Sarotherodon lohbergeri; Sarste: Sarotherodon steinbachi.
Figure 2
Figure 2
Relative abundance of core phyla (a) and genera (b) across all samples. Core taxa were defined by presence in all species and at least 80% of the specimens. Interquartile ranges (25th and 75th percentiles) and whiskers show data dispersion across specimens. Medians are shown as central horizontal lines.
Figure 3
Figure 3
α-Diversity by species as effective number of OTUs (Shannon entropy). Boxplots summarize values per species calculated on collated results after multiple rarefactions at a maximum depth of 13 730 reads (1000 reads step, 10 iterations). Boxplots are centered at and ordered by the median, while whiskers show data dispersion across conspecifics. Diversity can be substantially high at the intraspecific level for some species, while remarkably low in others (mostly carnivores). A clear trend is seen as a function of diet at both lakes, with carnivores showing a highly depleted diversity compared with herbivores. Removal of either poorly represented OTUs (<10 reads total) or selective inclusion only of the three main phyla (Firmicutes, Fusobacteria and Proteobacteria) provided a comparable pattern of α-diversity across species.
Figure 4
Figure 4
α-Diversity (Shannon entropy and phylogenetic diversity (PD) whole tree) by diet category in (a) Tanganyika and (b) Barombi Mbo. For each diet category, boxplots are centered at the median and whiskers show data dispersion across specimens (number within brackets) and ordered according to Shannon median values. Herbivores are significantly more diverse than carnivores at both lakes (P<0.05, two-sample t-test with Bonferroni correction). Statistically significant pairs are: for Tanganyika (both indexes), H versus SC, H vs C, O vs SC, O vs C, P vs C; for Barombi Mbo (PD whole tree only), H vs C, H vs O, H vs P, I vs C, and I vs O (P<0.05).
Figure 5
Figure 5
Principal coordinate analysis (PCoA) of cichlid gut bacterial communities according to lake (a and c) and diet (b and d). (a and b) Taxonomic (OTU) clustering based on unweighted UniFrac distances. Circles represent individual specimens, with ellipses showing range of variation after multiple rarefactions to an even depth (13 000 reads). (c and d) Functional (KO) composition clustering based on binary Jaccard, after rarefaction to 1 835 713 gene counts. Barombi Mbo (red) and Tanganyika (blue) specimens significantly separate at both the taxonomic (along PC2) and functional level (along PC3). Given the time of divergence between the two radiations, deep phylogenetic and geographic effects are here intrinsically linked. Within lakes, diet explains most taxonomic and functional bacterial variance, with a clear divergence between carnivores (C) and herbivores (H).
Figure 6
Figure 6
Phyloecospace of the Tanganyika microbiota data set shown by the first two significant PCs. (a) PC1 and PC2 correlation scores; (b and c) color plot of (b) PC1 and (c) PC2 scores on the cichlid phylogeny, with similar colors indicating comparable PC scores (that is, similar microbiotas). (b) PC1 carries a mix of ecological and phylogenetic signals, with clear examples of microbiota convergence among the herbivores Ophven, Varmoo and Intloo, belonging to three distinct tribes, and the scale eater Plestr (tribe Perissodini) and the carnivorous Enamel (tribe Ectodini) with the main carnivorous Lamprologini clade. (c) PC2 shows a strong phylogenetic signal largely driven by the two Neolamprologus species (Neosav and Neopul) and partly by the two species Erecya (Eretmodini) and Cypcol (Cyprichromini), unique representatives of two distant tribes. Stable isotopes and phylogenetic data for Cyprichromis coloratus (Cypcol) were approximated by the sister species C. leptosoma (sharing a similar trophic niche).
Figure 7
Figure 7
Discriminatory (a) OTUs, families and phyla and (b) functional pathways (KEGG L2) between herbivores and carnivores, according to both Barombi Mbo (B) and Tanganyika (T). Bars show differences between average reads for diet category, normalized to the sum of means (right-side bars: H-enriched; left-side bars: C-enriched) (Kruskal–Wallis, P<0.05, Bonferroni-corrected for Tanganyika and FDR-corrected for Barombi Mbo). OTUs were classified to their highest level of taxonomic resolution followed by the phylum. The two lakes showed a consistent trend of shared taxa and functional pathways enrichment according to diet categories. The core OTU-837283 (present in 85% of all specimens), corresponding to P. shigelloides, was detected also in our previous study (corresponding to former OTU-137 (Baldo et al., 2015)), and was here significantly enriched in carnivores of both lakes (a). See complete list of discriminatory OTUs in Supplementary Table 2 and functions in Supplementary Table 4.

References

    1. Adams DC. (2014). A generalized K statistic for estimating phylogenetic signal from shape and other high-dimensional multivariate data. Syst Biol 63: 685–697. - PubMed
    1. Afgan E, Baker D, van den Beek M, Blankenberg D, Bouvier D, Cech M et al. (2016). The Galaxy platform for accessible, reproducible and collaborative biomedical analyses: 2016 update. Nucleic Acids Res 44: W3–W10. - PMC - PubMed
    1. Ayayee PA, Larsen T, Rosa C, Felton GW, Ferry JG, Hoover K. (2016). Essential amino acid supplementation by gut microbes of a wood-feeding cerambycid. Environ Entomol 45: 66–73. - PMC - PubMed
    1. Baldo L, Riera JL, Tooming-Klunderud A, Alba MM, Salzburger W. (2015). Gut microbiota dynamics during dietary shift in Eastern African cichlid fishes. PLoS One 10: e0127462. - PMC - PubMed
    1. Baothman OA, Zamzami MA, Taher I, Abubaker J, Abu-Farha M. (2016). The role of gut microbiota in the development of obesity and diabetes. Lipids Health Dis 15: 108. - PMC - PubMed