Review
. 2016 Dec;8(4):347-358.
doi: 10.1007/s12551-016-0219-5. Epub 2016 Oct 17.

Biosensor binding data and its applicability to the determination of active concentration

Affiliations
Review

Biosensor binding data and its applicability to the determination of active concentration

Robert Karlsson. Biophys Rev. 2016 Dec.

Abstract

Protein concentration data are required for understanding protein interactions and are a prerequisite for the determination of affinity and kinetic properties. It is vital for the judgment of protein quality and for monitoring the effect of therapeutic agents. Protein concentration values are typically obtained by comparison to a standard and derived from a standard curve. The use of a protein standard is convenient, but may not give reliable results if samples and standards behave differently. In other cases, a standard preparation may not be available and has to be established and validated. Using surface plasmon resonance (SPR) biosensors, an alternative concentration method is possible. This method is called calibration-free concentration analysis (CFCA); it generates active concentration data directly and without the use of a standard. The active concentration of a protein is defined through its interaction with its binding partner. This concentration can differ from the total protein concentration if some protein fraction is incapable of binding. If a protein has several different binding sites, active concentration data can be established for each binding site using site-specific interaction partners. This review will focus on CFCA analysis. It will reiterate the theory of CFCA and describe how CFCA has been applied in different research segments. The major part of the review will, however, try to set expectations on CFCA and discuss how CFCA can be further developed for absolute and relative concentration measurements.

Keywords: Biomarker; CFCA; Protein quality; SPR; Simulation; Vaccine.


Conflict of interest statement

Conflict of interest

The author is employed by GE Healthcare Bio-Sciences AB, the provider of Biacore™ systems.

Ethical approval

This article does not contain any studies with human participants or animals performed by any of the authors.

Figures
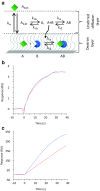
Fig. 1
Fig. 1
Transport and binding of analyte to a sensor surface. a Analyte (square) in solution enters an unstirred diffusion layer. A transport coefficient (km) describes transport across the diffusion layer to the sensor surface, where the analyte binds to its ligand (circle segment). Binding rates are defined by analyte and ligand concentrations and rate constants ka and kd. b, c Binding curves observed for β2μglobulin (100 nM) injected at flow rates of 5 (red curve) and 100 (blue curve) μL/min. b 142 RU of anti-β2μglobulin immobilized to sensor chip CM5: transport-independent binding. c 7150 RU of anti-β2μglobulin immobilized to sensor chip CM5: transport-dependent binding
Fig. 2
Fig. 2
Impact of the degree of mass transport limitation (MTL) on calibration-free concentration analysis (CFCA) data. Overlay plot of simulated and fitted data. Data were simulated for a one-to-one interaction with Rmax of 2000 RU, kd values of 1*10−2 s−1 (a, c, e, g) and 1*10−5 s−1 (b, d, f, h). Flow rates were 5 and 100 μL/min and the kt value at 1 μL/min was 4.88*108 RU*M−1*s−1. ka varied and was 7.6*103 M−1s−1 (a, b), 8.6*105 M−1s−1 (c, d), and 3.3*106 M−1s−1 (e, f, g, h). Analyte concentrations were 5, 10, and 20 nM (af) and 0.5, 1, and 2 nM (g, h). Each curve is identified by the scale to the right and this scale is applicable to both left and right sensorgram panels. As simulated and re-evaluated data are shown in an overlay plot, each subfigure contains 12 sensorgrams. In Fig. 2a, b, only three curves are visible, as data obtained with flow rates of 5 and 100 μL/min overlap almost completely. The resulting binding curves were re-analyzed using the CFCA model, which includes a dilution factor to allow for global analysis of a concentration series. The insert shows the degree of MTL calculated with Eq. 2, together with the expected Cexp (used in simulations) and found Cfound (determined by the CFCA algorithm) concentrations in nM
Fig. 3
Fig. 3
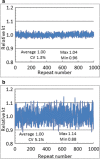
Predicted variation in kt values. Error spaces were assigned to the nominal values of the height and width of the flow cell, the flow rate, the distance to the detection center spot, and the detection spot length. a Variation over time in one Biacore system. b Hypothetical variation between 1000 Biacore systems. The text in each figure shows the average, relative standard deviation (%CV), and maximum and minimum values
Fig. 4
Fig. 4
Hypothetical distribution of analyte on sensor surfaces and in the surface plasmon resonance (SPR) evanescent field. a Electrostatical attraction of analyte to carboxymethylated dextran. b Binding of analyte to ligand immobilized to a low level. c Binding of analyte to ligand immobilized to a high level. d Immobilization of capture molecule to a high level, followed by capture of ligand and binding of analyte. e Binding of analyte to ligand immobilized on a surface without dextran matrix. The gray bar illustrates that the strength of the SPR signal is reduced with increasing distance from the gold surface

Similar articles

Cited by

References

    1. Abdiche YN, Yeung YA, Chaparro-Riggers J, Barman I, Strop P, Chin SM, Pham A, Bolton G, McDonough D, Lindquist K, Pons J, Rajpal K. The neonatal Fc receptor (FcRn) binds independently to both sites of the IgG homodimer with identical affinity. MAbs. 2015;7(2):331–343. doi: 10.1080/19420862.2015.1008353. - DOI - PMC - PubMed
    1. Allignet J, England P, Old I, El Solh N. Several regions of the repeat domain of the Staphylococcus caprae autolysin, AtlC, are involved in fibronectin binding. FEMS Microbiol Lett. 2002;213(2):193–197. doi: 10.1111/j.1574-6968.2002.tb11305.x. - DOI - PubMed
    1. Baker M. Blame it on the antibodies. Nature. 2015;521(7552):274–276. doi: 10.1038/521274a. - DOI - PubMed
    1. Bee C, Abdiche YN, Stone DM, Collier S, Lindquist KC, Pinkerton AC, Pons J, Rajpal A. Exploring the dynamic range of the kinetic exclusion assay in characterizing antigen–antibody interactions. PLoS One. 2012;7(4):e36261. doi: 10.1371/journal.pone.0036261. - DOI - PMC - PubMed
    1. Bee C, Abdiche YN, Pons J, Rajpal A. Determining the binding affinity of therapeutic monoclonal antibodies towards their native unpurified antigens in human serum. PLoS One. 2013;8(11):e80501. doi: 10.1371/journal.pone.0080501. - DOI - PMC - PubMed