Review
. 2016 Jun;8(2):121-138.
doi: 10.1007/s12551-016-0195-9. Epub 2016 Apr 29.

Design and development of genetically encoded fluorescent sensors to monitor intracellular chemical and physical parameters

Affiliations
Review

Design and development of genetically encoded fluorescent sensors to monitor intracellular chemical and physical parameters

Arno Germond et al. Biophys Rev. 2016 Jun.

Abstract

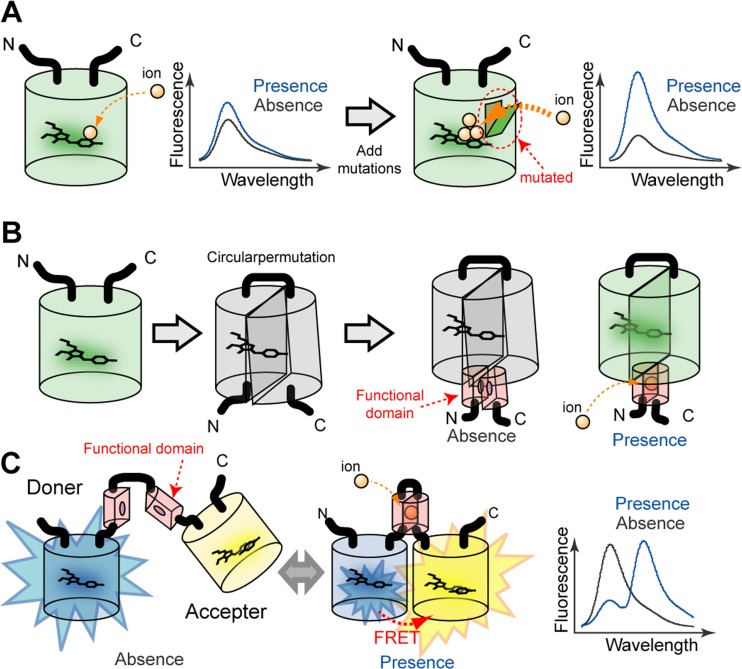
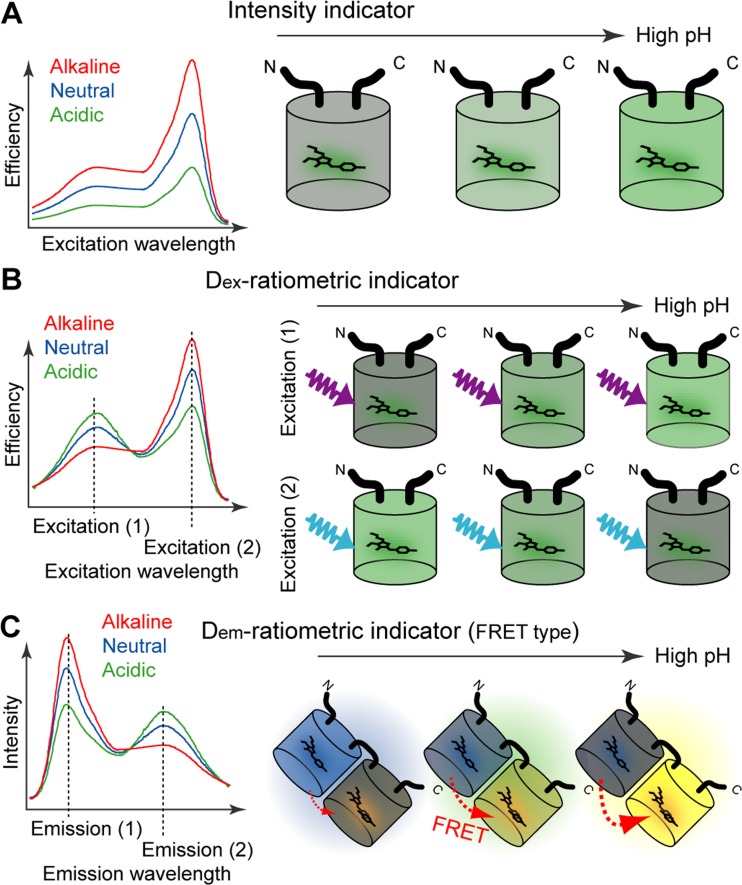
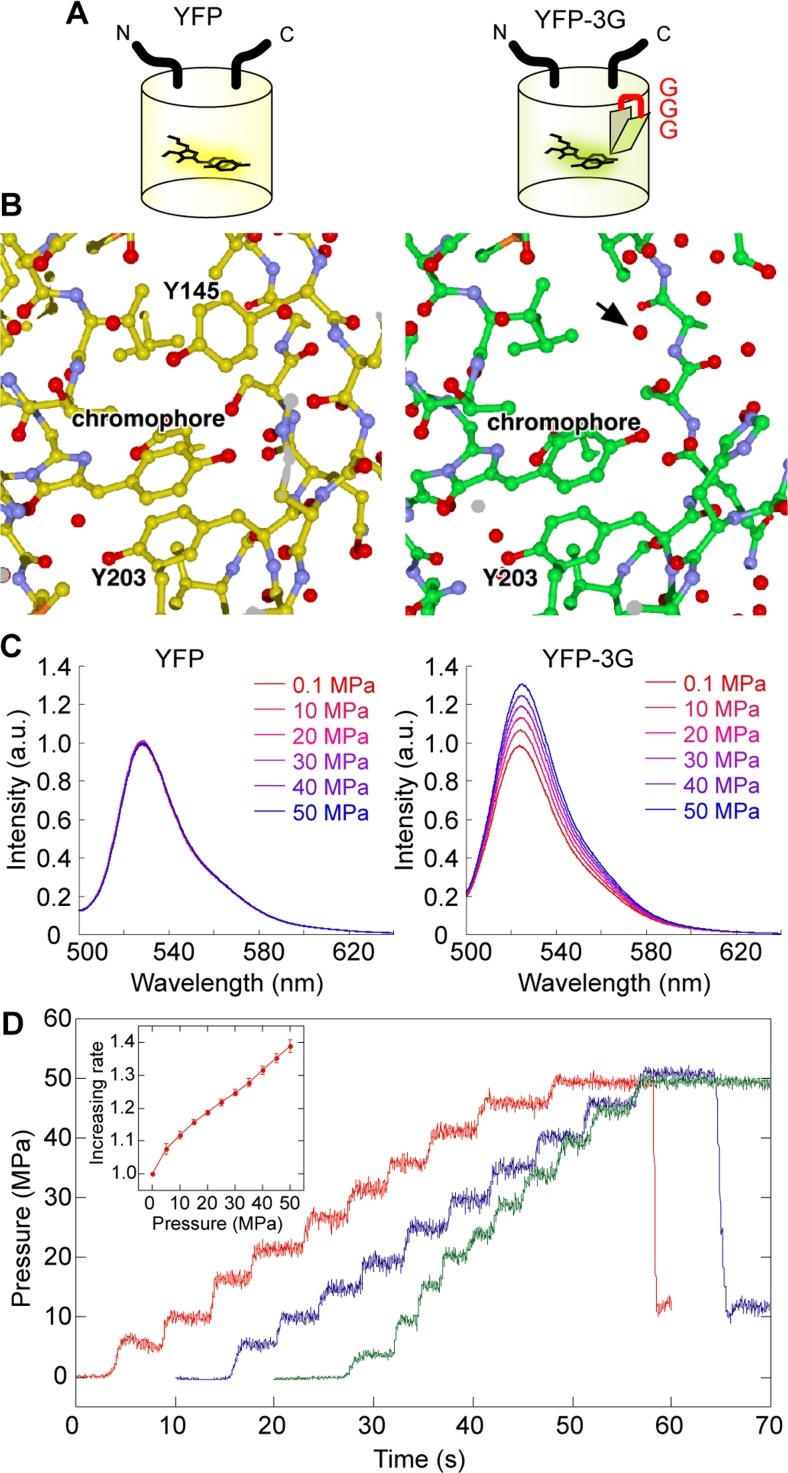
Over the past decades many researchers have made major contributions towards the development of genetically encoded (GE) fluorescent sensors derived from fluorescent proteins. GE sensors are now used to study biological phenomena by facilitating the measurement of biochemical behaviors at various scales, ranging from single molecules to single cells or even whole animals. Here, we review the historical development of GE fluorescent sensors and report on their current status. We specifically focus on the development strategies of the GE sensors used for measuring pH, ion concentrations (e.g., chloride and calcium), redox indicators, membrane potential, temperature, pressure, and molecular crowding. We demonstrate that these fluroescent protein-based sensors have a shared history of concepts and development strategies, and we highlight the most original concepts used to date. We believe that the understanding and application of these various concepts will pave the road for the development of future GE sensors and lead to new breakthroughs in bioimaging.

Keywords: Fluorescent measurement; Fluorescent protein; Genetically encoded; Green fluorescent protein; Intracellular sensor; Probe design.


Conflict of interest statement

Conflicts of interest

Arno Germond declares that he has no conflict of interest.

Hideaki Fujita declares that he has no conflict of interest.

Taro Ichimura declares that he has no conflict of interest.

Tomonobu M. Watanabe declares that he has no conflict of interest.

Ethical approval

This article does not contain any studies with human participants or animals performed by any of the authors.

Figures

Fig. 1
Fig. 1
Schematic drawing of the three main general strategies to develop genetically encoded (GE) sensors from fluorescent proteins (FPs). a Strategy 1: Employment of the intrinsic sensitivity of FPs to certain conditions of the solution environment. Researchers investigate the most effective mutations to enhance the sensitivity. b Strategy 2: Use of a circular-permutation technique in which the functional domain is fused with the circularly permutated FP, thereby converting the ion binding to fluorescence emission. c Strategy 3: Use of the Förster resonance energy transfer (FRET) technology. The functional domain between the donor and the accepter converts the ion binding to the fluorescence spectrum
Fig. 2
Fig. 2
Schematic drawing of main three kinds of FP indicator. a Intensity indicator: the fluorescent intensity depends on the environment of the solution. b Dual excitation mode (D ex) ratiometric indicator: the excitation spectrum shows two peaks that respond in an antiparallel manner to the solution environment; two distinct excitations are needed. (b) Dual emission mode (D em) ratiometric indicator: the emission spectrum shows two peaks that respond in an antiparallel manner to the solution environment
Fig. 3
Fig. 3
Yellow fluorescent protein (YFP) and a pressure-sensitive yellow fluorescent protein variant (YFP-3G). a Schematic drawing of YFP and YFP-3G. b Crystal structure of YFP (left) and YFP-inserted ‘GGG’ (right). Arrow indicates the oxygens included in water molecules filling the space of YFP’s Tyr145. (c) Pressure-dependant fluorescence of YFP (left) and YFP-3G (right) at 0.1 (red) to 50 (blue) MPa. All spectra are normalized with the spectrum at 0.1 MPa. The traces represent the average of six individual trials. d Time-course changes in fluorescence intensity measured at 515–535 nm with increasing hydrostatic pressure at steps of 5 MPa. Different colors indicate different trials. Insert Calibration table showing the changes in fluorescence and hydrostatic pressure as a ratio

Similar articles

Cited by

References

    1. Akemann W, Mutoh H, Perron A, Park YK, Iwamoto Y, Knöpfel T. Imaging neural circuit dynamics with a voltage-sensitive fluorescent protein. J Neurophysiol. 2012;108:2323–2337. doi: 10.1152/jn.00452.2012. - DOI - PubMed
    1. Aoki K, Kamioka Y, Matsuda M. Fluorescence resonance energy transfer imaging of cell signaling from in vitro to in vivo: basis of biosensor construction, live imaging, and image processing. Dev Growth Differ. 2013;55:515–522. doi: 10.1111/dgd.12039. - DOI - PubMed
    1. Arosio D, Garau G, Ricci F, Marchetti L, Bizzarri R, Nifosì R, Beltram F. Spectroscopic and structural study of proton and halide ion cooperative binding to GFP. Biophys J. 2007;93:232–244. doi: 10.1529/biophysj.106.102319. - DOI - PMC - PubMed
    1. Ataka K, Pieribone VA. A genetically targetable fluorescent probe of channel gating with rapid kinetics. Biophys J. 2002;82:509–516. doi: 10.1016/S0006-3495(02)75415-5. - DOI - PMC - PubMed
    1. Baird GS, Zacharias DA, Tsien RY. Circular permutation and receptor insertion within green fluorescent proteins. Proc Natl Acad Sci USA. 1999;96:11241–11246. doi: 10.1073/pnas.96.20.11241. - DOI - PMC - PubMed