

Review
doi: 10.1007/s12551-016-0197-7.
Epub 2016 May 4.
UV-Vis spectroscopy of tyrosine side-groups in studies of protein structure. Part 2: selected applications
Affiliations
- PMID: 28510057
- PMCID: PMC4884208
- DOI: 10.1007/s12551-016-0197-7
Item in Clipboard
Review
UV-Vis spectroscopy of tyrosine side-groups in studies of protein structure. Part 2: selected applications
Biophys Rev.
2016 Jun.
Abstract
In Part 2 we discuss application of several different types of UV-Vis spectroscopy, such as normal, difference, and second-derivative UV absorption spectroscopy, fluorescence spectroscopy, linear and circular dichroism spectroscopy, and Raman spectroscopy, of the side-chain of tyrosine residues in different molecular environments. We review the ways these spectroscopies can be used to probe complex protein structures.
Keywords: Fluorescence; Linear and circular dichroism; Resonance Raman scattering; Tyrosine; UV–Vis absorption.
Conflict of interest statement
Jan M. Antosiewicz declares that he has no conflict of interest. David Shugar declares that he has no conflict of interest.
Figures
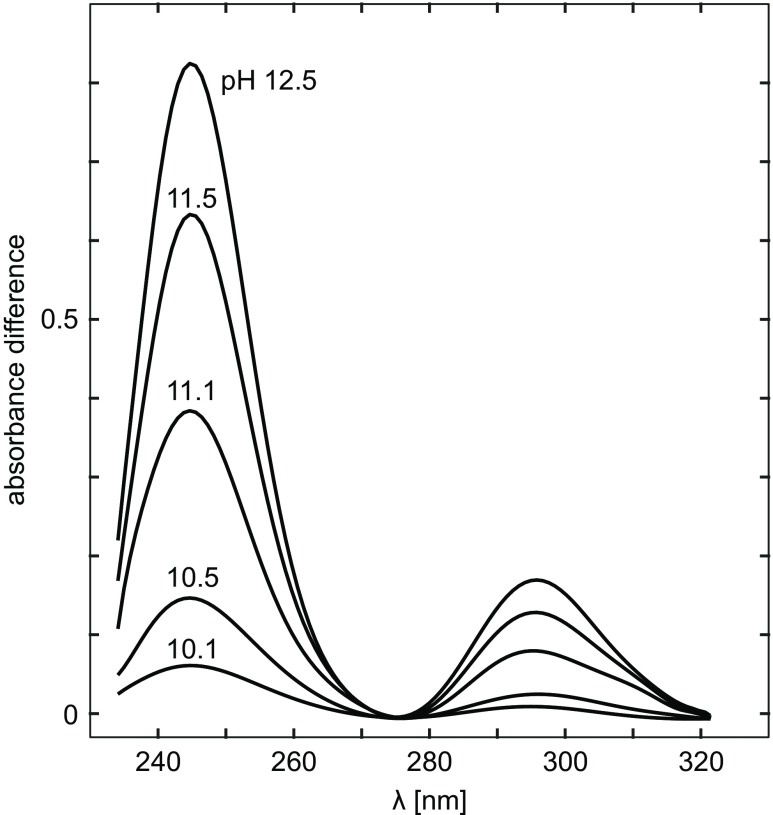
The difference spectra of actin as a function of pH. Protein concentration is 0.17 mg/ml. The reference solution is of the same protein concentration at pH 7.3. Taken from Mihashi and Ooi (Mihashi and Ooi 1965)
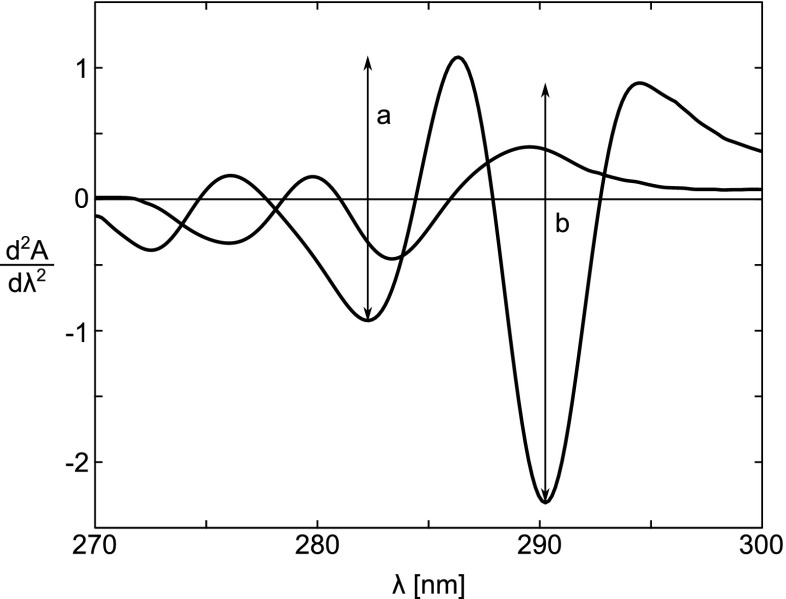
Second-derivative spectra of equimolar solutions of N-Ac-Trp-NH2 and N-Ac-Tyr-NH2 dissolved in 6.0 M Gdn ⋅HC–0.05 M phosphate, pH 6.5. The spectrum of N-Ac-Trp-NH2 is identified by the two arrowsa and b, which indicate the peak-to-peak distances between the maximum at 287 nm and the minimum at 283 nm, and the maximum at 295 nm and the minimum at 290.5 nm, respectively. Taken from Ragone et al. (1984)
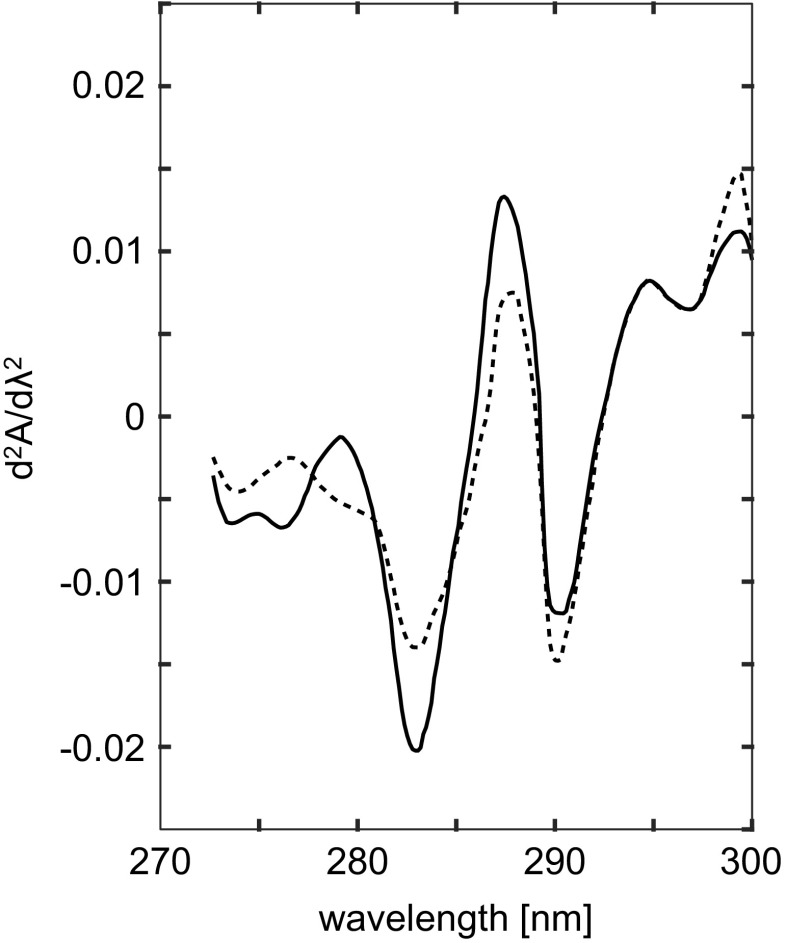
Isosbestic point at ∼284.2 nm in the second-derivative spectra of 2.3 μM native (50 mM Tris/acetate buffer pH 7.4; full line) and Gdn ⋅HCl denatured MM-creatine kinase (50 mM Tris/acetate, 6 M Gdn,HCl buffer pH 7.4; dotted line). Adapted from Leydier et al. (1997)
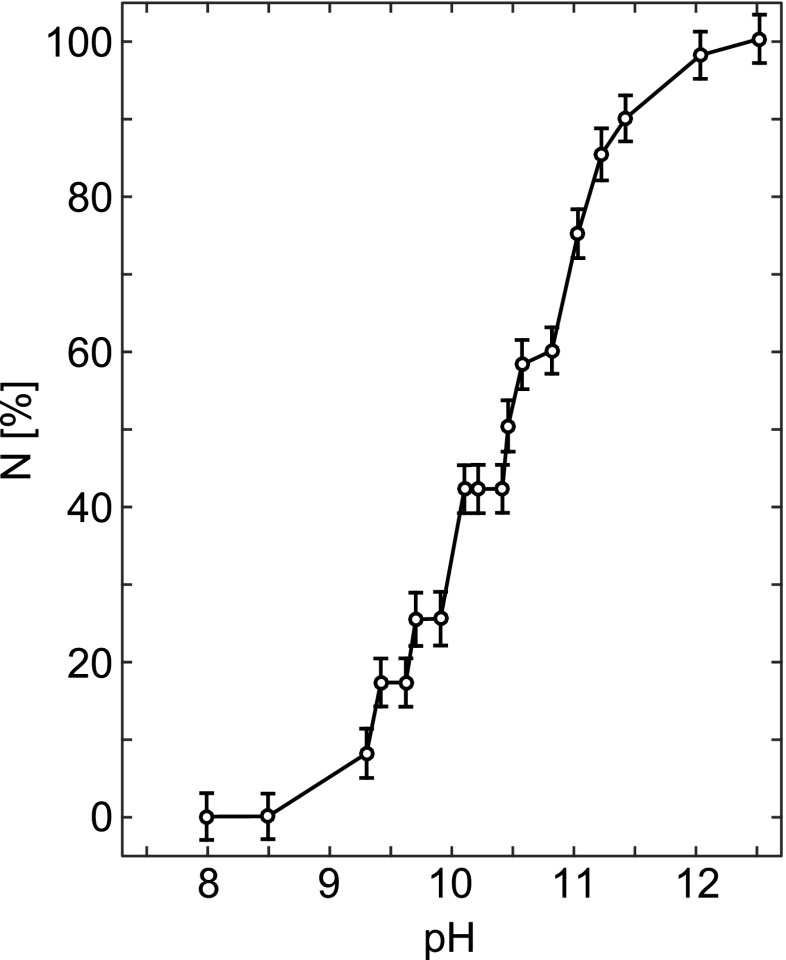
Titration curve of the Tyr residues in Carlsberg subtilisin obtained by the difference SDUV method, shown as % of ionized Tyr residues, N, vs. pH. Adapted from Breydo et al. (1997)
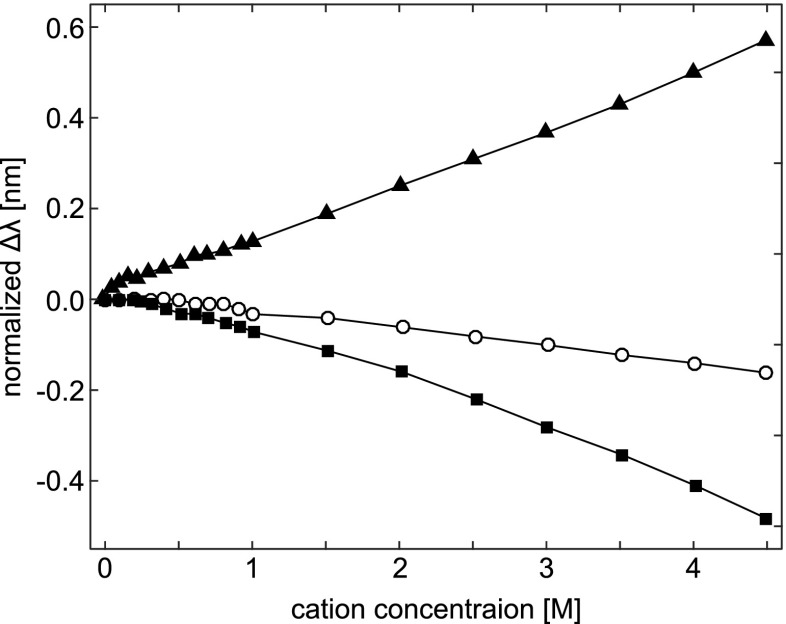
Peak shifts (Δλ) in the second-derivative UV absorption spectra for the model amino acid, N-acetyl-l -tyrosine ethyl ester, induced by the cations Li + (filled squares), Na + (open circles), and Cs + (filled triangles). The peak positions at each concentration point are normalized by subtracting the initial peak position, which was 275.01 ±0.01 nm. Taken from Lucas et al. (2006)
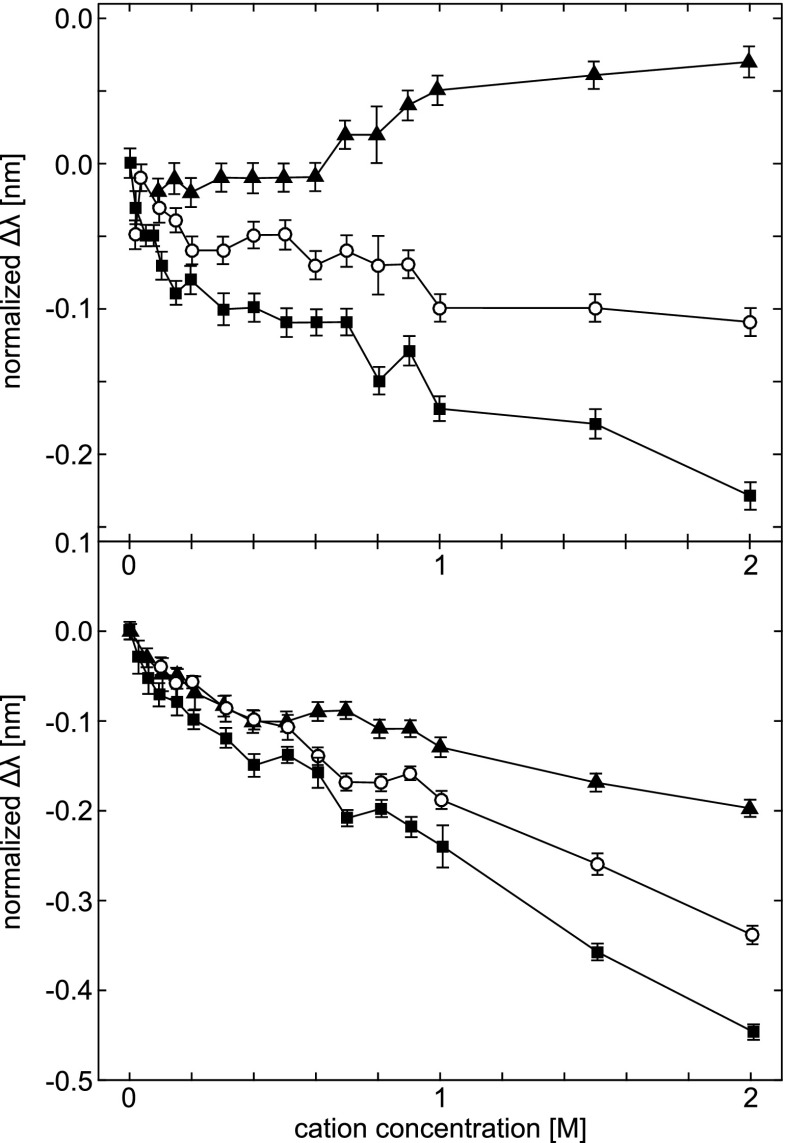
Tyr peak shifts in the second-derivative UV absorption spectra of Ribonuclease T1 (top) and human serum albumin (bottom), induced by the cations Li + (filled squares), Na + (open circles), and Cs + (filled triangles). The data are displayed as in Fig. 5, with initial peak positions of 277.61 ±0.01 nm for RNAse T1, and 278.82 ± 0.01 nm for HSA. Error bars represent the standard deviation of the mean for three experiments for each salt. Taken from Lucas et al. (2006)
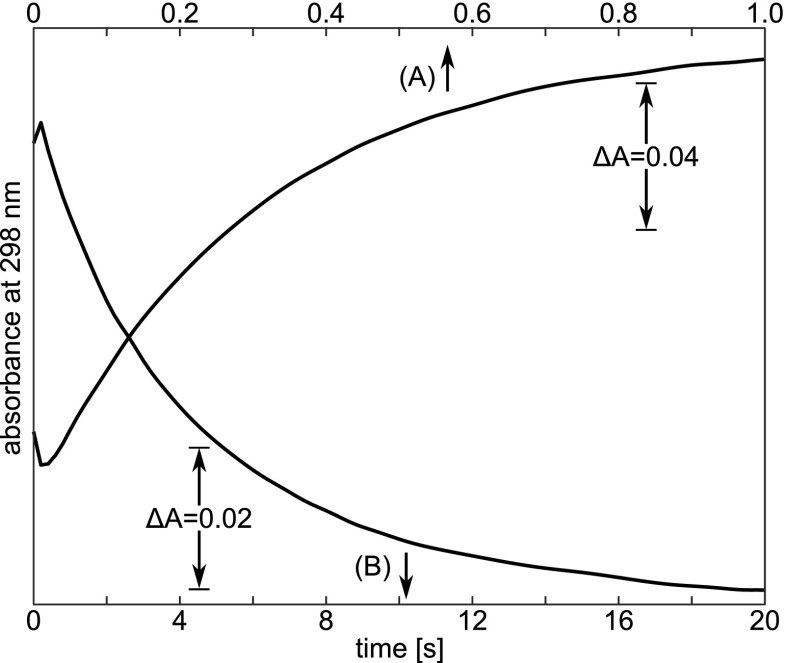
Typical time-courses of the absorption changes at 298 nm after a pH-jump at 0.5 M Gdm-HCl and 25.0 ∘C : a forward pH-jump from pH 5.5 to 11.3; and b reversed pH-jump from 11.8 to 10.2. Protein concentration is ca. 0.05 %. Taken from Kuwajima et al. (1979)
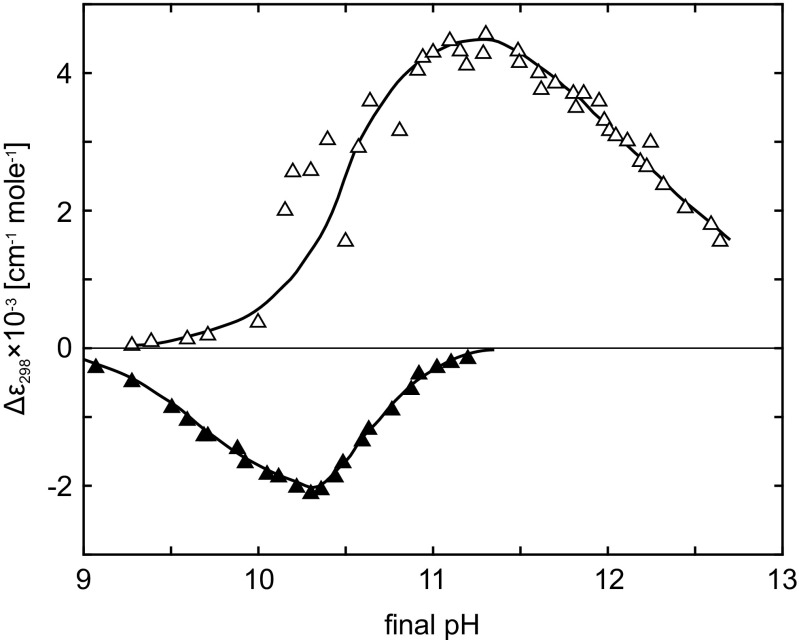
Dependence of (empty triangles) and (full triangles) on final pH. Taken from Kuwajima et al. (1979)
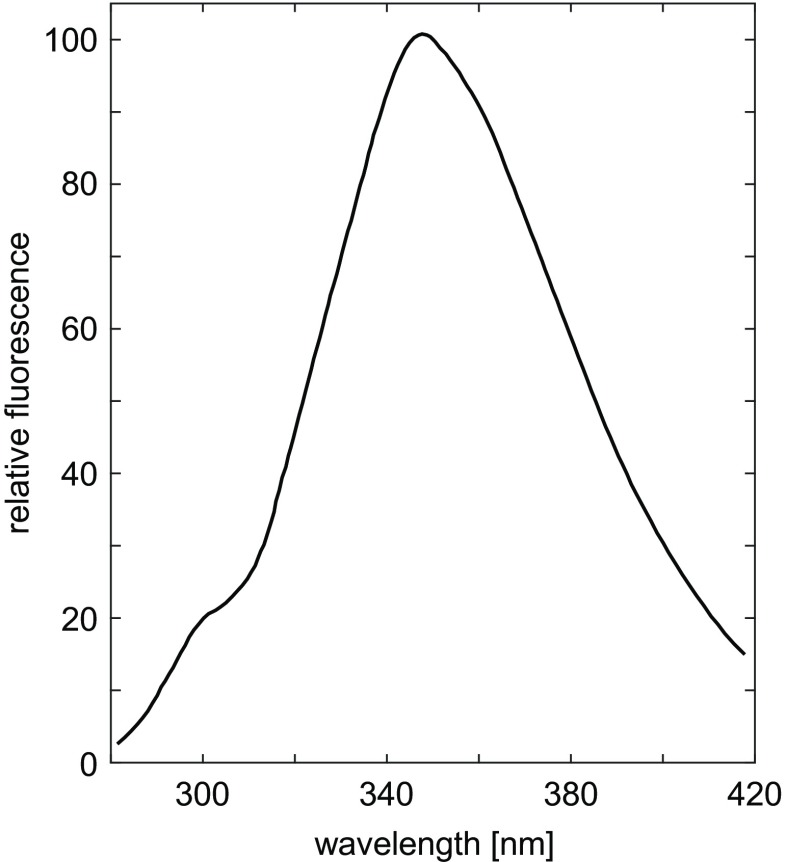
Fluorescence spectrum of PTH, pH 6.1, 0.08M KCl, 0.02M lysine, with excitation at 270 nm. Adapted from Edelhoch et al. (1969)
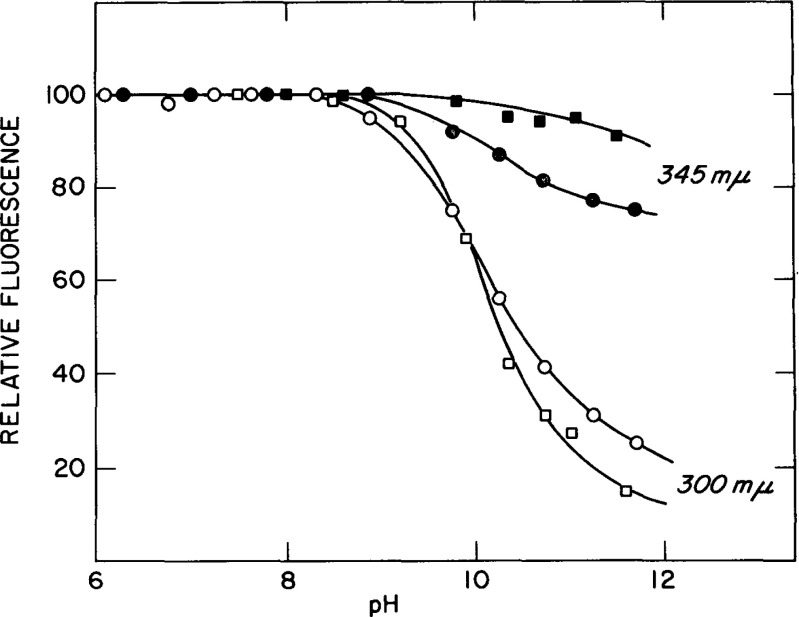
The alkaline dependence of tyrosyl (300 nm) and tryptophan (345 nm) fluorescence of PTH in aqueous solution (circles) 0.090M KCl, 0.02M lysine and in 4.6 M guanidine-HCl (squares). Excitation at 270 nm at 25 ∘C. Taken from Edelhoch et al. (1969)
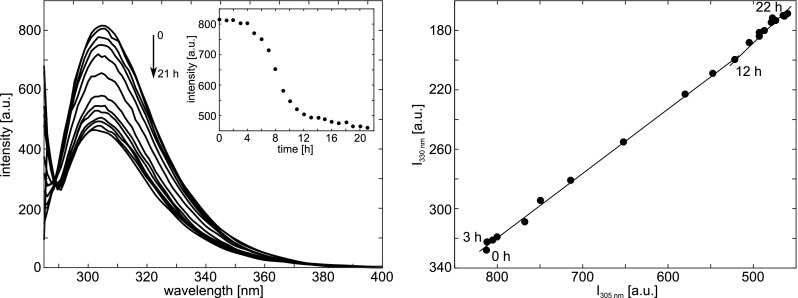
Left: Fluorescence emission spectra of Tyr during insulin aggregation initiated by incubation under conditions favoring fibrillation. Spectra registered at 1-h intervals are shown. The inset shows a sigmoidal change observed in the emission intensity at 305 nm as a function of time; Right: Phase diagram obtained from Tyr fluorescence data that reveal the existence of structural intermediates on thermal denaturation of insulin. Taken from Bekard and Dunstan (2009)
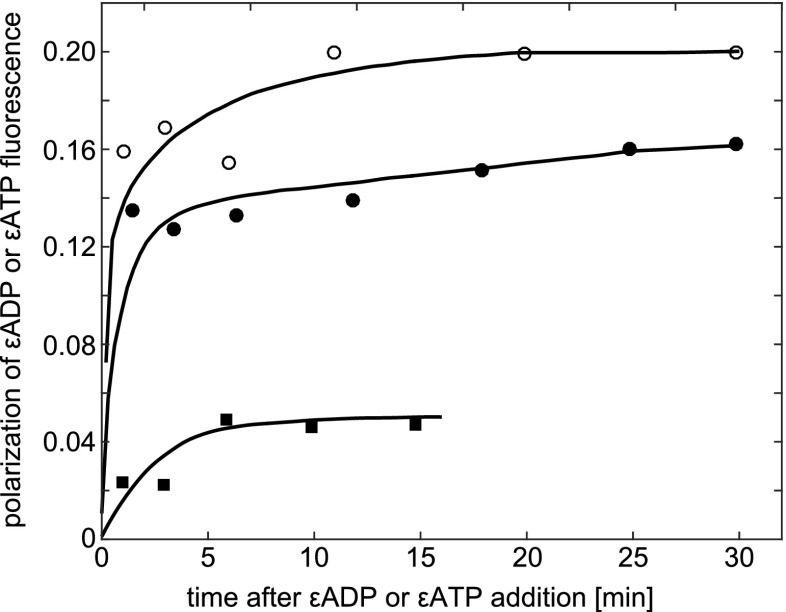
The effect of various salts on polarization of Tyr fluorescence in ATP synthase. The medium contained 25 mM tricine-NaOH (pH 8.2) and 3.6 μM protein. Taken from VanderMeulen and Govindjee (1977)
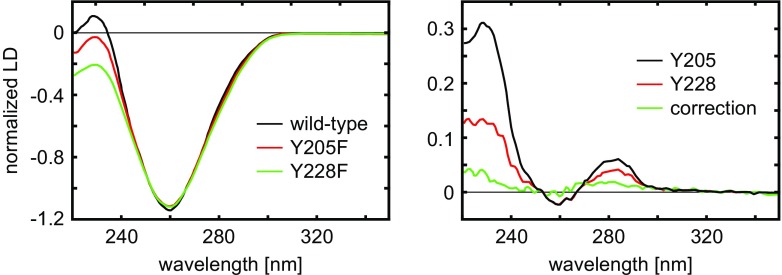
Left: Experimental flow LD spectra of wild-type and two selected modified HsRad51 nucleo-protein complexes; Right: resulting SSLD spectra for the corresponding Tyr residues. Adapted from Reymer et al. (2009)
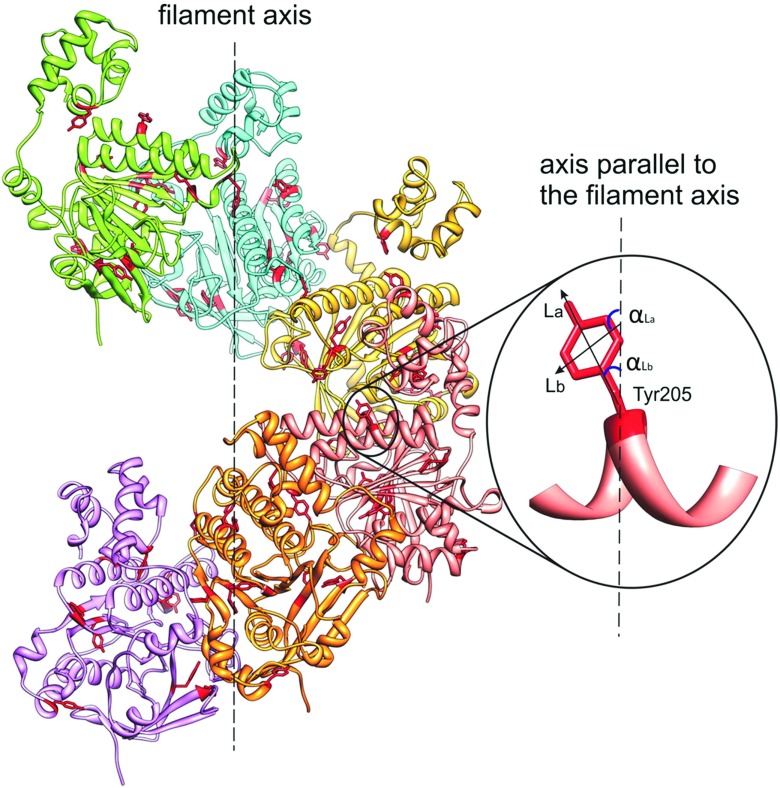
Molecular model of the HsRad51 helical filament showing the angular orientations of transition moments La and Lb of Tyr-205 residue, relative to the filament axis. Taken from Reymer et al. (Reymer et al. 2009)
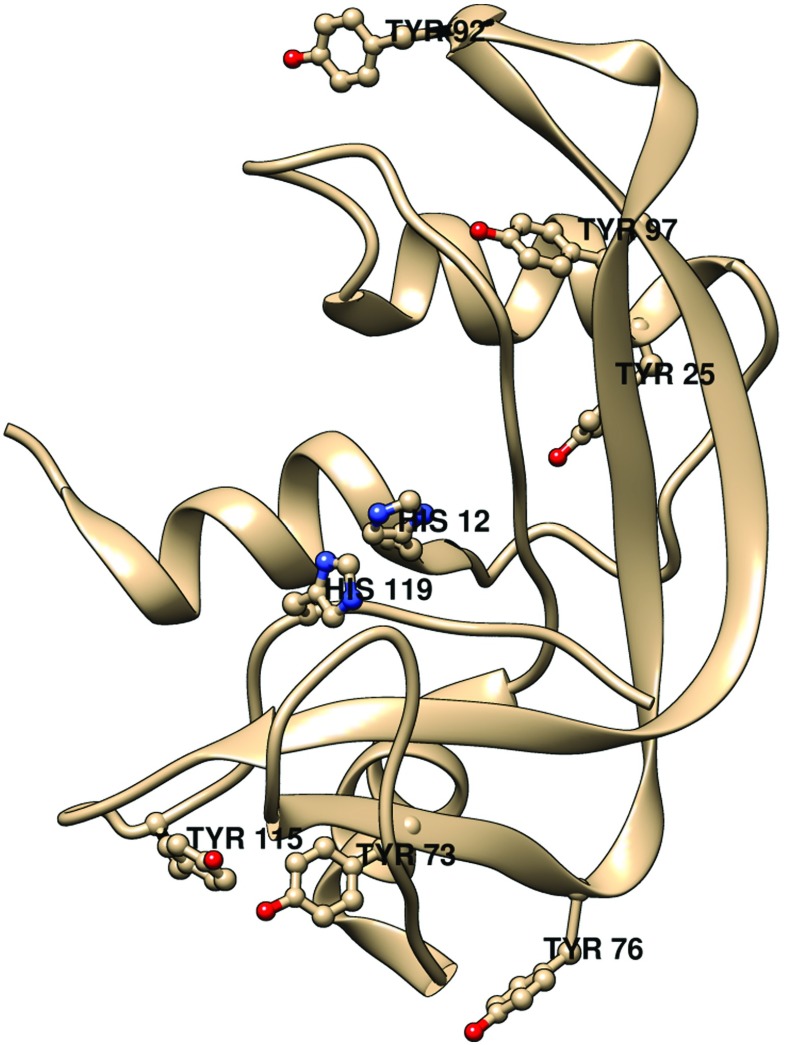
A ribbon diagram of bovine pancreas RNase-A showing the six tyrosines. His12 and His119 are also shown to indicate the location of the active site. Generated by USCF Chimera [REF: Pettersen EF, Goddard TD, Huang CC, Couch GS, Greenblatt DM, Meng EC, Ferrin TE (2004) J Comput Chem 25:1605] from the structure of RNase A by Howlin et al. (1989).
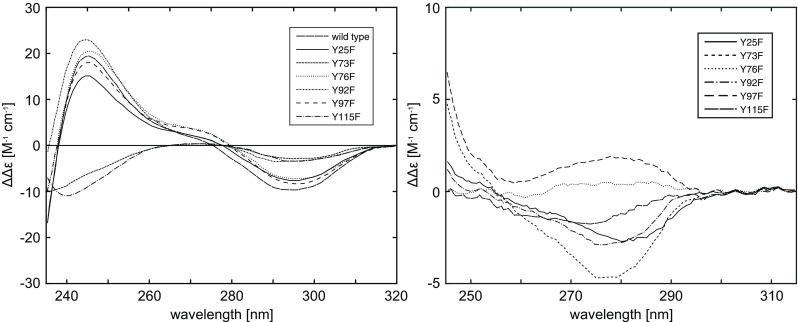
Left: The pH difference CD spectra (pH 11.3 and 7.0, 2 ∘C) of RNase A wild-type and Tyr →Phe mutants.; Right: Experimental near-UV CD difference spectra (2 ∘C) of RNase-A wild-type minus the mutants at pH 7.0. Taken from Woody and Woody (2003)
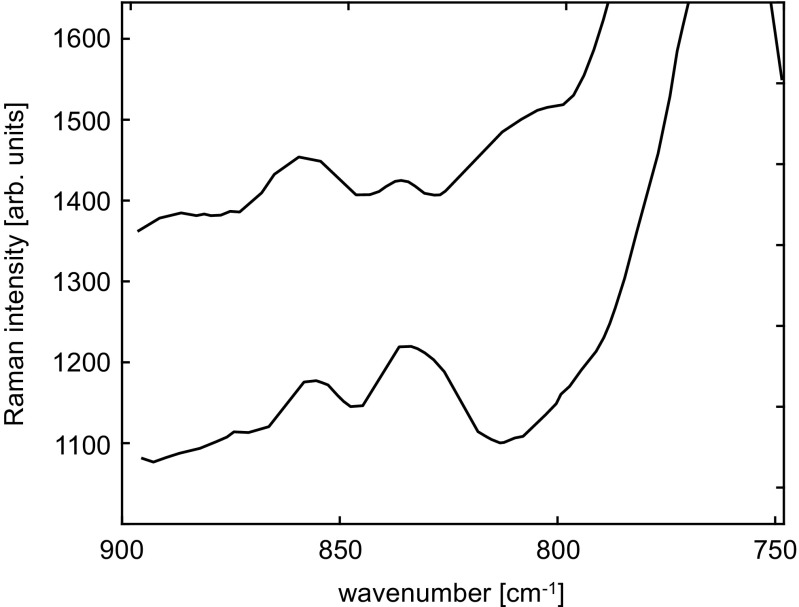
Resonance Raman spectra of barnase in the range 750-890 cm −1 obtained with excitation wavelength 244 nm, for denatured wild-type barnase (pH 1.5, top) and folded wild-type barnase (pH 6.3, bottom). The spectra have been displaced for clarity. Adapted from Couling et al. (1997)
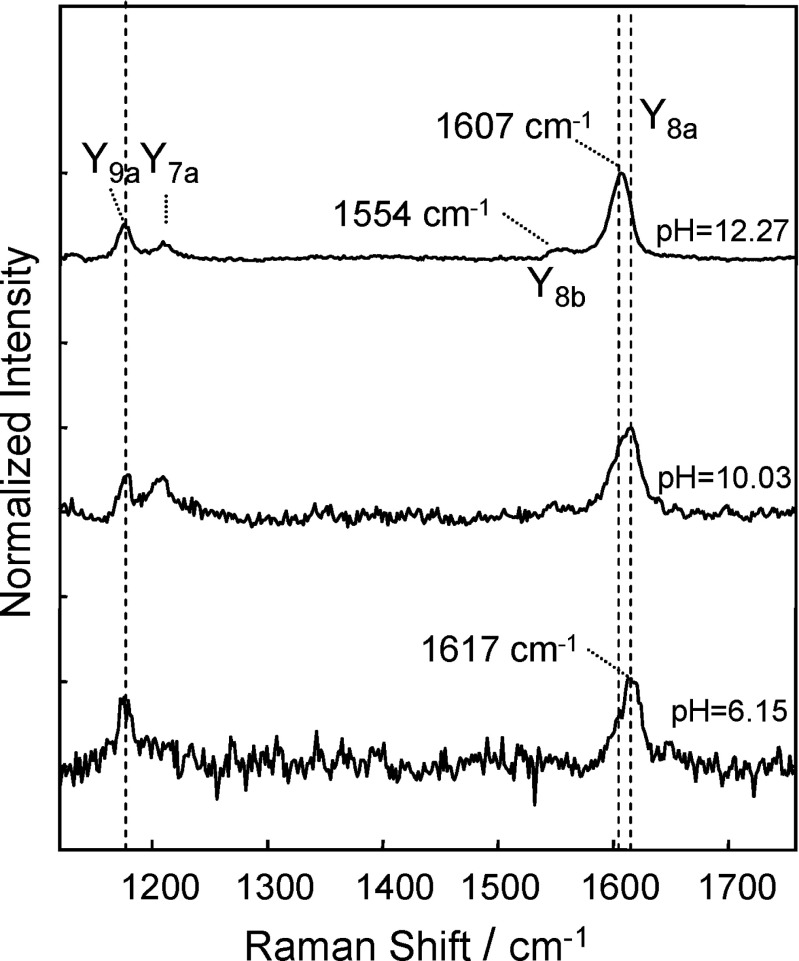
Resonance Raman spectra of TTR(105-115), in the wave-number range corresponding to vibrations of the phenolic side-chain of the tyrosines, excited at 239.5 nm, for three selected values of pH: 6.15, 10.03, and 12.27. Taken from Pieridou and Hayes (2009)
References
-
- Aitken A, Learmonth MP (2009) Protein protocols handbook. In: Walker JM (ed) Springer protocols handbooks. chap. 1. Humana Press, New York, pp 3–6
Publication types
LinkOut - more resources
Full Text Sources
Other Literature Sources
