Review
. 2011 Sep;3(3):119.
doi: 10.1007/s12551-011-0051-x. Epub 2011 Jul 19.

Measuring the flow of molecules in cells

Affiliations
Review

Measuring the flow of molecules in cells

Elizabeth Hinde et al. Biophys Rev. 2011 Sep.

Abstract

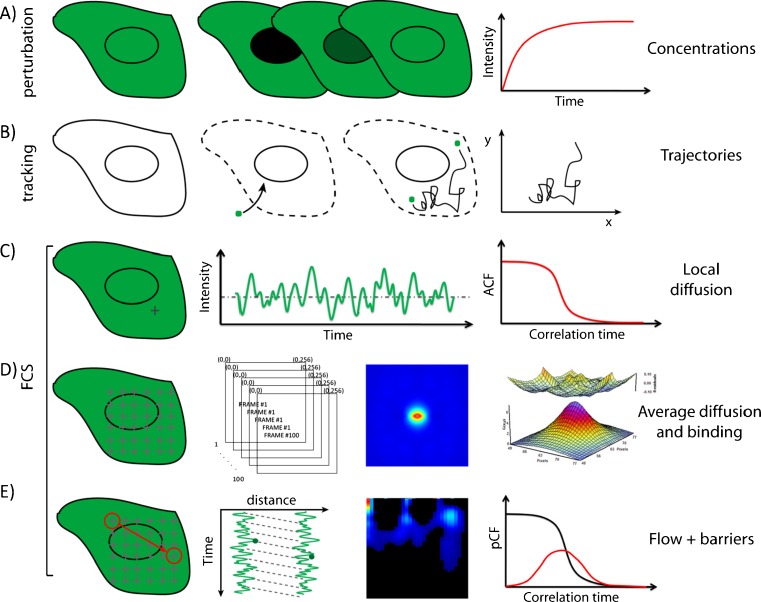
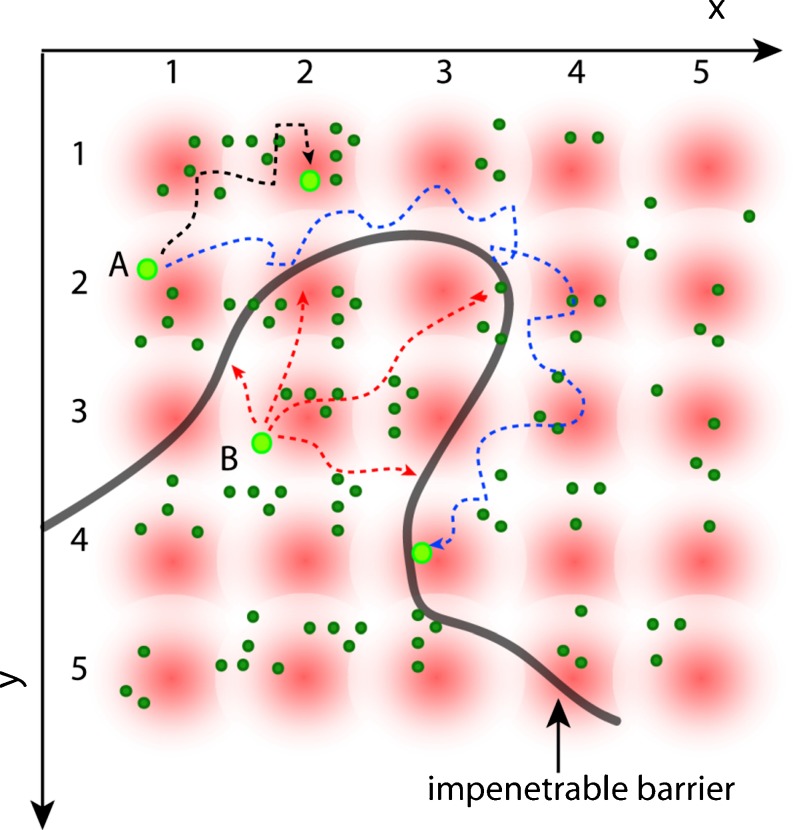
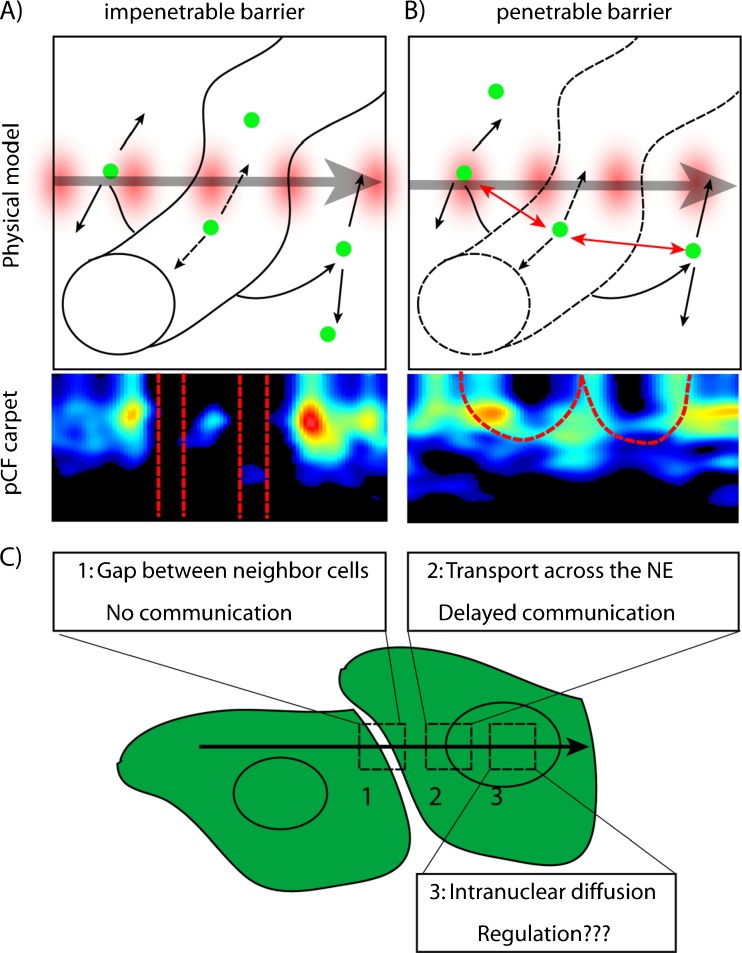
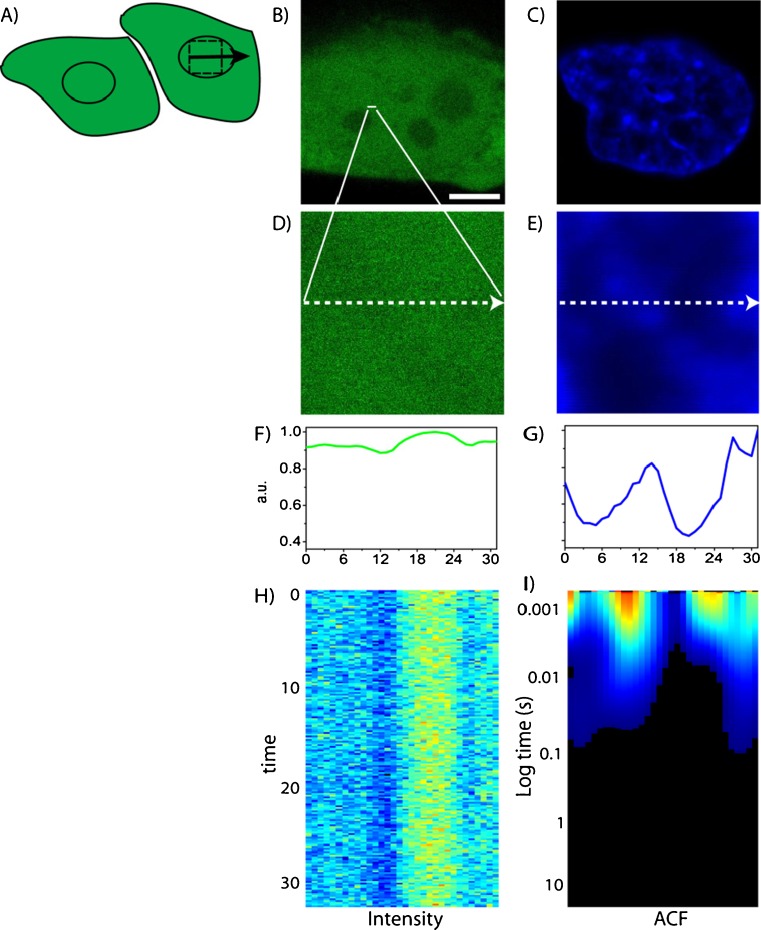
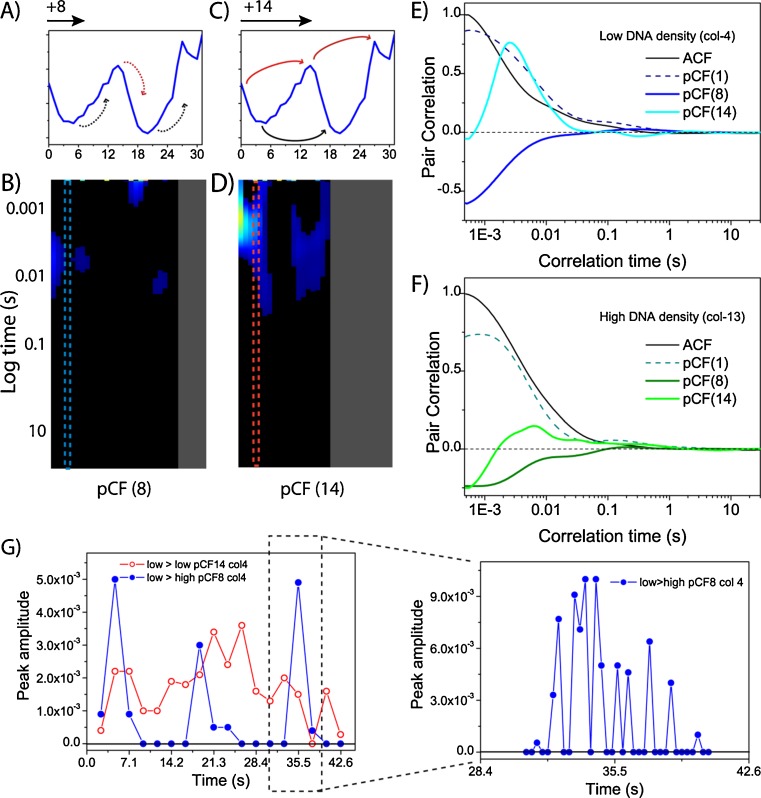
No methods proposed thus far have the capability to measure molecular flow in live cells at the single molecule level. Here, we review the potentiality of a newly established method based on the spatial correlation of fluorescence fluctuations at a pair of points in the sample (pair correlation method). The pair correlation function (pCF) offers a unique tool to probe the directionality of intracellular traffic, by measuring the accessibility of the cellular landscape and its role in determining the diffusive routes adopted by molecules. The sensitivity of the pCF method toward detection of barriers means that different structural elements of the cell can be tested in terms of penetrability and mechanisms of regulation imparted on molecular flow. This has been recently demonstrated in a series of studies looking at molecular transport inside live cells. Here, we will review the theory behind detection of barriers to molecular flow, the rules to interpret pCF data, and relevant applications to intracellular transport.

Keywords: Intracellular transport; Molecular flow; Pair correlation function; Spatial correlation.


Figures

Fig. 1
Fig. 1
Comparison of the different methods available to probe intracellular diffusion. a FRAP is an ensemble measurement that provides temporal information on the recovery of the concentration of molecules without knowledge of where the fluorescence recovery originates from. b SPT requires purification, labeling and microinjection of the molecule of interest into cells; furthermore, a high statistic is needed to recover the molecular trajectories accurately. c The information obtained by the classical single-point FCS analysis is intrinsically local (one point at a time can be sampled in the cell). d RICS is a spatial temporal correlation method that takes into account how the cellular environment tested interacts with the molecules of interest, as well as what causes the net rate of molecular transport observed. Given the symmetry of the RICS correlation function, however, the direction of the flow or the behaviour of molecules at large distance cannot be determined. e The pair correlation method can measure the directionality of molecular flow by correlation the fluctuations at an arbitrary pair of points in the sample. By doing this, it is sensitive to the presence of barriers and/or obstacles to molecular diffusion
Fig. 2
Fig. 2
Schematic of the spatial pair-correlation method. The fluorescence intensity is rapidly sampled (compared with the motion of the particles) at several points in a grid (x, y) and repeatedly in time. An impenetrable barrier (black line) is placed in the grid defining two disconnected regions. Molecules are allowed to diffuse freely within both regions but not across the boundary. Only the same particle will produce an average cross-correlation with a given time delay at two different points in the grid. For example, the fluctuations of intensity at position (1,2) from molecule ‘A’ will correlate with the fluctuations at position (2,1) if the molecule ‘A’ is moving to that position. Analogously, the same molecule can be detected at position (3,4) in the grid, but after a certain delay due to the time needed to pass around the obstacle. Instead, if we consider the paths allowed for molecule ‘B’ to diffuse from position (2,3) we find that fluctuation of intensity will never correlate with points on the other side of the barrier. Thus, if we cross-correlate the intensity fluctuations at each point of the grid, we produce a map of molecular flow with a resolution given by the size of the PSF
Fig. 3
Fig. 3
Rules to interpret molecular flow in the pCF carpet. We simulate diffusion of a particle in a plane in the presence of a region with a barrier to enter and exit that can be impenetrable or penetrable. a The pCF carpet derived for the impenetrable barrier displays characteristic gap regions (absence of communication). b When communication is allowed between the two regions, the pCF carpet displays characteristic arc shapes due to delayed but positive communication. c We envision an experiment in which a line is scanned across different types of barriers: 1 the impenetrable gap between two non-communicating cells; 2 the nuclear envelope; 3 the nucleoplasm of the cell, where molecular diffusion will be evaluated with no ‘a priori’ knowledge. Panels (a) and (b) are partly taken from Hinde et al. (2011)
Fig. 4
Fig. 4
Application of pair correlation to expected barriers in cells. a A line is scanned across the border of two neighbor cells. b, c Intensity and pCF(7) carpets. The pCF(7) analysis highlights the presence of the impenetrable gap. The corresponding plot (right) does not yield a maximum of correlation in the gap (even at very long times). Scale bar 5 μm. d Here a line is scanned across the NE. e, f Intensity and pCF(11) carpets. The pCF(11) analysis highlights the presence of delayed communication across the NE. From the average pCF(11), two columns are extracted, 14 and 18, corresponding to regions of different cytoplasm-to-nucleus transport kinetics (i.e. passive diffusion and active import, see text). Scale bar of the image 5 μm. Figure partly taken from Cardarelli and Gratton (2010)
Fig. 5
Fig. 5
ACF carpet analysis of intranucelar diffusion in an interphase nucleus. a A line is scanned across the chromatin in the interphase nucleus (scale bar 5 μm). b– e Free GFP (green) in a CHOK1 nucleus stained with Hoechst 33342 (blue). f, g Intensity profiles of GFP and Hoechst 33342 across the line drawn. h, i Fluorescence intensity carpet and ACF carpet of the line drawn across freely diffusing GFP. Figure partly taken from Hinde et al. (2010)
Fig. 6
Fig. 6
pCF carpet analysis of intranuclear diffusion. a, b Intensity profile of the Hoechst 33342 stain across the line measured. c, d pCF carpets corresponding to the distances of 8 and 14 pixels, respectively. e, f Plot of the amount of correlation for column 4 and 13 at each analysed distance (0, 8 and 14). Curves are normalized to 1 with respect to the ACF. g Decomposition of column 4 into shorter time fragments (5,000 lines, 2.36 s) at the two calculated distances. A plot of the maximum amplitude of correlation detected for each fragment against the time of acquisition is shown. A peak in the pCF(8) analysis is further decomposed every 600 lines (300 ms) (right plot). Figure partly taken from Hinde et al. (2010)
Fig. 7
Fig. 7
Schematic representation of the ‘burst’ model. Two disconnected volumes are generated by the chromatin structure. The inert tracer GFP does diffuse throughout the high chromatin density networked channel (blue) as well as the low chromatin density surroundings, with intermittent bursts of molecules traversing the channel barrier (red arrows). Many possible intranuclear processes may be responsible for the observed GFP behavior. All of them are energy-consuming processes and involve the local dynamic rearrangement of chromatin structure
Fig. 8
Fig. 8
GFP molecular flow in the C.elegans germ line. a The adult germ line of C.elegans expressing monomeric GFP, with the nuclei stained with Hoechst 33342. b, c Overlay of GFP and Hoechst-33342 signals for two analyzed cells. d, e Intensity profile of GFP and Hoechst-33342 across the line measured. f The pCF(9) carpet derived in the interphase nucleus, showing gaps of correlation. g The pCF(8) carpet derived in a nucleus actively undergoing mitosis, showing delayed communication. Figure partly taken from Hinde et al. (2011)

Similar articles

Cited by

References

    1. Calapez A, Pereira HM, Calado A, Braga J, Rino J, Carvalho C, Tavanez JP, Wahle E, Rosa AC, Carmo-Fonseca M. The intranuclear mobility of messenger RNA binding proteins is ATP dependent and temperature sensitive. J Cell Biol. 2002;159(5):795–805. doi: 10.1083/jcb.200203046. - DOI - PMC - PubMed
    1. Cardarelli F, Gratton E. In vivo imaging of single-molecule translocation through nuclear pore complexes by pair correlation functions. PLoS One. 2010;5(5):e10475. doi: 10.1371/journal.pone.0010475. - DOI - PMC - PubMed
    1. Cardarelli F, Serresi M, Bizzarri R, Giacca M, Beltram F. In vivo study of HIV-1 Tat arginine-rich motif unveils its transport properties. Mol Ther. 2007;15(7):1313–1322. doi: 10.1038/sj.mt.6300172. - DOI - PubMed
    1. Cardarelli F, Serresi M, Bizzarri R, Beltram F. Tuning the transport properties of HIV-1 Tat arginine-rich motif in living cells. Traffic. 2008;9(4):528–539. doi: 10.1111/j.1600-0854.2007.00696.x. - DOI - PubMed
    1. Cardarelli F, Bizzarri R, Serresi M, Albertazzi L, Beltram F. Probing nuclear localization signal-importin alpha binding equilibria in living cells. J Biol Chem. 2009;284(52):36638–36646. doi: 10.1074/jbc.M109.036699. - DOI - PMC - PubMed

LinkOut - more resources