Review
. 2015 Dec;7(4):421-447.
doi: 10.1007/s12551-015-0184-4. Epub 2015 Nov 19.

Historical perspective on heart function: the Frank-Starling Law

Affiliations
Review

Historical perspective on heart function: the Frank-Starling Law

Vasco Sequeira et al. Biophys Rev. 2015 Dec.

Abstract

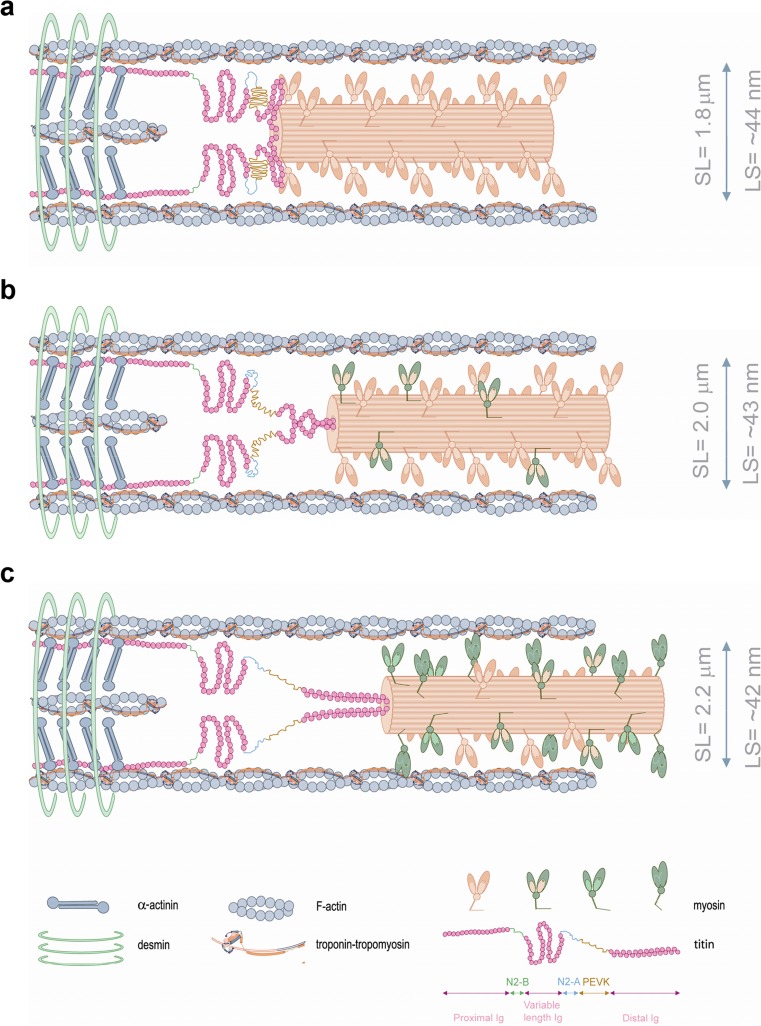
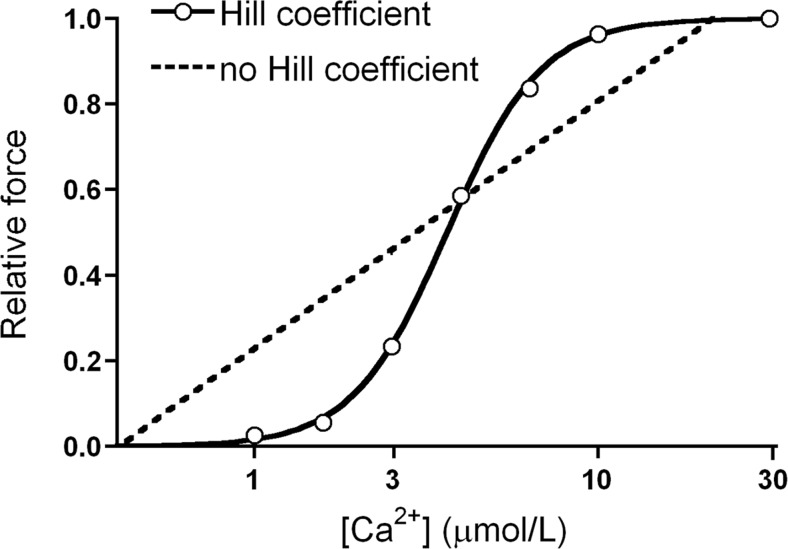
More than a century of research on the Frank-Starling Law has significantly advanced our knowledge about the working heart. The Frank-Starling Law mandates that the heart is able to match cardiac ejection to the dynamic changes occurring in ventricular filling and thereby regulates ventricular contraction and ejection. Significant efforts have been attempted to identify a common fundamental basis for the Frank-Starling heart and, although a unifying idea has still to come forth, there is mounting evidence of a direct relationship between length changes in individual constituents (cardiomyocytes) and their sensitivity to Ca2+ ions. As the Frank-Starling Law is a vital event for the healthy heart, it is of utmost importance to understand its mechanical basis in order to optimize and organize therapeutic strategies to rescue the failing human heart. The present review is a historic perspective on cardiac muscle function. We "revive" a century of scientific research on the heart's fundamental protein constituents (contractile proteins), to their assemblies in the muscle (the sarcomeres), culminating in a thorough overview of the several synergistically events that compose the Frank-Starling mechanism. It is the authors' personal beliefs that much can be gained by understanding the Frank-Starling relationship at the cellular and whole organ level, so that we can finally, in this century, tackle the pathophysiologic mechanisms underlying heart failure.

Keywords: Cardiomyocytes; Frank–Starling; Heart; History; Myofilaments.


Conflict of interest statement

Conflict of interest

Vasco Sequeira declares that he has no conflict of interest.

Jolanda van der Velden declares that she has no conflict of interest.

Ethical approval

This article does not contain any studies with human or animal subjects performed by the authors.

Figures

Fig. 1
Fig. 1
A schematic overview of the cardiovascular system overtime. a Veins (blue) and arteries (white) are separate. Veins transport blood, in opposition to arteries that transport air. b Arteries (red) transport blood from right side of the heart, after it passes through invisible pores in the septum. c Establishment of the pulmonary circulation that transports blood through the lungs to the left side of the heart, and the liver was the source of veins the propelling power of blood. d Harvey’s view of the cardiovascular system. (Adapted from (2011) with permission)
Fig. 2
Fig. 2
Anatomy of cardiac muscle. The upper figure illustrates a group of myofibrils connected to the sarcolemma via the costamere network. The lower image shows an individual sarcomere. Note the formation of distinct bands. The components are not drawn to scale. (Adapted from Sequeira et al. (2013a))
Fig. 3
Fig. 3
a Diagram of myosin arrangement in the thick filament. b Represents actin molecules polarity pointing away from the Z-line. (adapted from Huxley (1971) with permission)
Fig. 4
Fig. 4
A schematic of myosin (adapted from Huxley (1971)). Here S 1 represents the myosin head, S 1 and S 2 comprise the cross-bridge, and LMM forms the bulk of the thick filament
Fig. 5
Fig. 5
Cross-bridge cycle. (Adapted from Gordon et al. (2000) with permission)
Fig. 6
Fig. 6
An early model of the thin filament structure. (Ebashi et al. (1969))
Fig. 7
Fig. 7
Modern schematic model of the thin filament functional unit. Five actin monomers (gray) spanned by one tropomyosin dimer (red) and one troponin complex: cTnC (pink), cTnI (blue) and cTnT (orange). N and C depict N- and C-terminal protein ends, respectively. Dark-blue tropomyosin depicts near-neighbor tropomyosin dimer interaction (Greenfield et al. ; Murakami et al. 2008). Myosin-S1 is depicted in solid green (light-green myosin-S1 to better understand its transition states). The orientation of thin filament proteins is: the N-terminal region of cTnT points towards the pointed end (M-band), while the core domain of the troponin complex is oriented to the barbed end (Z-disk) (Paul et al. 2009). Interacting sites and structural regions of actin-tropomyosin-troponin proteins are matched in accordance with available literature (Sequeira et al. 2013b). Cardiac TnI residues 1-34 are arbitrarily positioned. Our figure follows the proposed mechanism for Ca2+-regulation of contraction proposed by Murakami et al. (2005) (Adapted from Sequeira et al. (2013b))
Fig. 8
Fig. 8
A schematic overview of titin depicted in half-sarcomere. Note the extension of the elastic components of titin when the sarcomere is stretched. (Adapted from Linke and Kruger (2010))
Fig. 9
Fig. 9
A schematic domain structure of cMyBP-C. Cardiac MyBP-C consists of eight Ig-like and three fibronectin domains labeled C0 (N-terminus) through C10 (C-terminus). Two additional domains are present in the N-terminal part of the protein, the Proline-Alanine rich region (PA) and the M-domain (M). Four phosphorylation sites (Ser275, Ser284, Ser304 and Ser311) have been described in the M-domain. A recent study (Kuster et al. 2013) revealed a novel phosphorylation site on serine 133 in the PA region. (Adapted from Sequeira et al. (2013c))
Fig. 10
Fig. 10
Schematic structure of cMyBP-C. cMyBP-C consists of eight Ig and three fibronectin domains labeled C0 (N-terminal) to C10 (C-terminal), with two additional linker domains the PA (Proline-Alanine; light blue stripes) region between C0 and C1, and the M-domain (M; yellow and orange stripes), between C1 and C2. The C5–C10 domains extend along the thick filament, while the C0-C4 extend to the thin filament. A7TmTn depict a functional unit composed of 7 actin monomers, 1 tropomyosin (Tm) dimer and 1 troponin (Tn) complex
Fig. 11
Fig. 11
A schematic model of thin filament transitions. Seven actin monomers (gray) spanned by one tropomyosin dimer (red) and one troponin complex: cardiac troponin C (pink), cardiac troponin I (blue) and cardiac troponin T (orange). N and C indicate the N- and C-terminal ends of protein. This diagram is based on the structure of actin subdomains (Kabsch et al. ; Murakami et al. 2010), the position of tropomyosin on F-actin (Lehman et al. ; Pirani et al. ; Vibert et al. 1997) and the core domain of human troponin (Takeda et al. ; Vinogradova et al. 2005). The tropomyosin overlap region (head-to-tail) depicts interaction with near-neighbor tropomyosin dimer (dark-blue) (Greenfield et al. ; Murakami et al. 2008). The orientation of thin filament proteins is as follows: the N-terminal region of cardiac troponin T points towards the pointed end (M-band), while the core domain of the troponin complex is oriented to the barbed end (Z-disk) (Paul et al. 2009). Interacting sites and structural location of actin-tropomyosin-troponin proteins were matched the best as possible in accordance with the available literature (Murakami et al. ; Takeda et al. ; Pearlstone and Smillie , ; Biesiadecki et al. , ; Morris and Lehrer ; Manning et al. ; Tardiff 2011). a B-state (blocked); when ATP is present and cytoplasmic [Ca2+] is low and is not bound to cTnC, tropomyosin is sterically blocking the myosin-binding sites on actin. b C-state (Ca2+-induced); cytoplasmic [Ca2+] rises such that Ca2+ binds to cTnC, inducing conformational changes of the troponin complex, resulting in a ~25° movement of tropomyosin on the thin filament, thereby exposing most of the myosin-binding sites on actin. Note the movement of tropomyosin away from subdomains 1 and 2 of actin. In the C-state, the myofilament is not yet activated as non-tension-generating cross-bridges bind weakly to actin. c M-state (myosin-induced); the strong-binding of tension-generating cross-bridges induces a ~10° movement of tropomyosin on actin, resulting in myofilament activation and contraction. Note the transition of tropomyosin into subdomains 3 and 4 of actin. (Adapted from Sequeira et al. (2013b) with permission)
Fig. 12
Fig. 12
A comparison of length-tension relationships for skeletal and cardiac muscle. Skeletal muscle As proposed by Gordon et al. (1966) using the frog heart, a maximal plateau region over the range of 2.0 and 2.25 μm sarcomere length is expected due to optimal and constant myofilament overlap. When the muscle is stretched above 2.25 μm (descending limb) active tension declines to almost zero at a sarcomere length of 3.65 μm. At shorter sarcomere lengths (below 2.0 μm) (ascending limb) the thin filaments collide in the middle of the sarcomere, and thick filaments collide at the Z-disc and tension ceases. Cardiac muscle The myofilament overlap theory that was the basis for skeletal muscle length-tension relationships cannot account for the cardiac length-tension relationship. Apart from the smaller sarcomere lengths at which the mammalian heart operates (estimated physiological levels range from 1.8 to 2.2 μm), cardiac muscle was demonstrated to present length-dependent changes in activation. Please note that skeletal muscle almost fully activates at 75 % Lmax (length at which force is maximal), which contrasts with cardiac muscle where at the same % of Lmax, active tension is zero. Lengthening cardiac muscle an extra 15 % in length (~90 % Lmax) raises the developed tension from 0 up to 70 %, hence active tension in cardiac muscle is length-dependent. Diagrams adapted from Gordon et al. (1966), Sonnenblick and Skelton (1974), and Allen et al. (1974)
Fig. 13
Fig. 13
A schematic model of half-sarcomere at varying sarcomere lengths. Lattice spacing dimensions at each varying length were taken from Konhilas et al. (2002b). As the muscle is stretched from a relatively short sarcomere length (a) to higher sarcomere lengths (b, c), lattice spacing becomes smaller with increased transition of order cross-bridges (a; projection of cross-bridges in X-ray diffraction studies) into disorder (active) states (b, c). The I-band region of titin is the extensible region and consists of three elastic components that act as a spring element: (1) tandem immunoglobulin (Ig)-like domain regions, with proximal (near Z-disc) and distal (near I-A regions) segments; (2) the PEVK sequence-region rich in proline (P), glutamic acid (E), valine (V) and lysine (K); and (3) the N2B and N2BA elements (both isoforms contain N2B segments, but only the N2BA isoform contains an additional N2A element) (Labeit and Kolmerer 1995). Titin-induced stretch imposes a passive strain on the thick filament proteins, reduces lattice spacing and changes the arrangement of cross-bridges. Distinct myosin colors are depicted to better illustrate the transition of ordered to disordered projections. α-actinin and desmin illustrate the Z-disc border. According to detailed calculations from Gordon et al. (2000), ~1 cross-bridge binds each A7TmTn. Note: cardiac myosin-binding protein C (cMyBP-C) was omitted to simplify the drawing and the width and sarcomere length dimensions are not to scale
Fig. 14
Fig. 14
Cooperativity in cardiac muscle. In this plot of Ca2+ versus relative force the solid line depicts a unique cooperative relationship between [Ca2+] and force. The dashed line depicts a hypothetical system where cooperative activation is non-existent (x-axis here is non-logarithmic)

References

    1. Abbott BC, Mommaerts WFHM. A study of inotropic mechanisms in the papillary muscle preparation. J Gen Physiol. 1959;42:533–561. doi: 10.1085/jgp.42.3.533. - DOI - PMC - PubMed
    1. Agarkova I, Perriard J-C. The M-band: an elastic web that crosslinks thick filaments in the center of the sarcomere. Trends Cell Biol. 2005;15:477–485. doi: 10.1016/j.tcb.2005.07.001. - DOI - PubMed
    1. Aird W. Discovery of the cardiovascular system: from Galen to William Harvey. J Thromb Haemost. 2011;9:118–129. doi: 10.1111/j.1538-7836.2011.04312.x. - DOI - PubMed
    1. Allen DG, Kentish JC. The cellular basis of the length-tension relation in cardiac muscle. J Mol Cell Cardiol. 1985;17:821–840. doi: 10.1016/S0022-2828(85)80097-3. - DOI - PubMed
    1. Allen D, Kentish J. Calcium concentration in the myoplasm of skinned ferret ventricular muscle following changes in muscle length. J Physiol. 1988;407:489–503. doi: 10.1113/jphysiol.1988.sp017427. - DOI - PMC - PubMed

LinkOut - more resources