

Bioluminescent Antibodies for Point-of-Care Diagnostics
- PMID: 28510347
- PMCID: PMC5488172
- DOI: 10.1002/anie.201702403
Bioluminescent Antibodies for Point-of-Care Diagnostics
Abstract
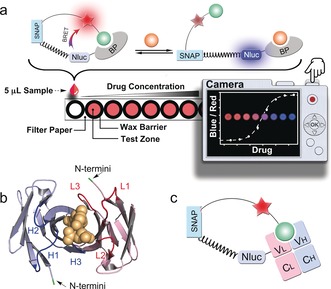
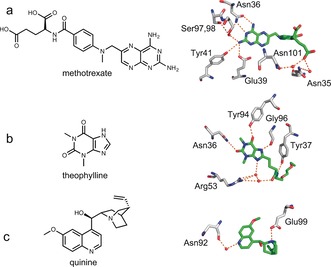
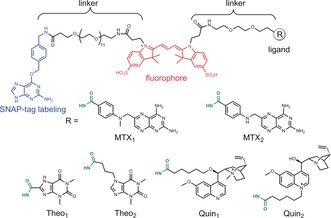
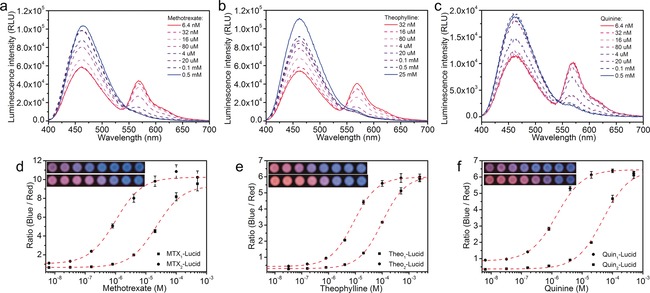
We introduce a general method to transform antibodies into ratiometric, bioluminescent sensor proteins for the no-wash quantification of analytes. Our approach is based on the genetic fusion of antibody fragments to NanoLuc luciferase and SNAP-tag, the latter being labeled with a synthetic fluorescent competitor of the antigen. Binding of the antigen, here synthetic drugs, by the sensor displaces the tethered fluorescent competitor from the antibody and disrupts bioluminescent resonance energy transfer (BRET) between the luciferase and fluorophore. The semisynthetic sensors display a tunable response range (submicromolar to submillimolar) and large dynamic range (ΔRmax >500 %), and they permit the quantification of analytes through spotting of the samples onto paper followed by analysis with a digital camera.
Keywords: antibodies; bioluminescence; point-of-care monitoring; sensors; therapeutic drug monitoring.
© 2017 The Authors. Published by Wiley-VCH Verlag GmbH & Co. KGaA.
Figures
Similar articles
-
BRET Q-Body: A Ratiometric Quench-based Bioluminescent Immunosensor Made of Luciferase-Dye-Antibody Fusion with Enhanced Response.Anal Chem. 2021 Jun 1;93(21):7571-7578. doi: 10.1021/acs.analchem.0c05217. Epub 2021 May 20. Anal Chem. 2021. PMID: 34013723
-
Ratiometric Bioluminescent Sensor Proteins Based on Intramolecular Split Luciferase Complementation.ACS Sens. 2019 Jan 25;4(1):20-25. doi: 10.1021/acssensors.8b01381. Epub 2018 Dec 14. ACS Sens. 2019. PMID: 30525479 Free PMC article.
-
BRET Nano Q-Body: A Nanobody-Based Ratiometric Bioluminescent Immunosensor for Point-of-Care Testing.ACS Sens. 2024 Nov 22;9(11):5955-5965. doi: 10.1021/acssensors.4c01800. Epub 2024 Nov 11. ACS Sens. 2024. PMID: 39526666
-
Highly Modular Bioluminescent Sensors for Small Molecules and Proteins.Methods Enzymol. 2017;589:365-382. doi: 10.1016/bs.mie.2017.01.005. Epub 2017 Feb 28. Methods Enzymol. 2017. PMID: 28336070 Review.
-
Biosensing strategies using recombinant luminescent proteins and their use for food and environmental analysis.Anal Bioanal Chem. 2024 Dec;416(30):7205-7224. doi: 10.1007/s00216-024-05552-x. Epub 2024 Sep 26. Anal Bioanal Chem. 2024. PMID: 39325139 Review.
Cited by
-
Chimeric Protein Switch Biosensors.Adv Biochem Eng Biotechnol. 2024;187:1-35. doi: 10.1007/10_2023_241. Adv Biochem Eng Biotechnol. 2024. PMID: 38273207 Review.
-
A plug-and-play platform of ratiometric bioluminescent sensors for homogeneous immunoassays.Nat Commun. 2021 Jul 28;12(1):4586. doi: 10.1038/s41467-021-24874-3. Nat Commun. 2021. PMID: 34321486 Free PMC article.
-
Bioluminescence Imaging of Potassium Ion Using a Sensory Luciferin and an Engineered Luciferase.J Am Chem Soc. 2024 May 15;146(19):13406-13416. doi: 10.1021/jacs.4c02473. Epub 2024 May 2. J Am Chem Soc. 2024. PMID: 38698549 Free PMC article.
-
Development and Applications of Bioluminescent and Chemiluminescent Reporters and Biosensors.Annu Rev Anal Chem (Palo Alto Calif). 2019 Jun 12;12(1):129-150. doi: 10.1146/annurev-anchem-061318-115027. Epub 2019 Feb 20. Annu Rev Anal Chem (Palo Alto Calif). 2019. PMID: 30786216 Free PMC article. Review.
-
"Ready-to-use" immunosensor for the detection of small molecules with fast readout.Biosens Bioelectron. 2022 Apr 1;201:113968. doi: 10.1016/j.bios.2022.113968. Epub 2022 Jan 6. Biosens Bioelectron. 2022. PMID: 35007993 Free PMC article.
References
-
- Saint-Marcoux F., Sauvage F.-L., Marquet P., Anal. Bioanal. Chem. 2007, 388, 1327–1349. - PubMed
-
- Dasgupta A., Datta P., Handbook of Drug Monitoring Methods, Humana, Totowa, NJ, 2008, pp. 67–86.
-
- Griss R., Schena A., Reymond L., Patiny L., Werner D., Tinberg C. E., Baker D., Johnsson K., Nat. Chem. Biol. 2014, 10, 598–603. - PubMed
-
- Arts R., den Hartog I., Zijlema S. E., Thijssen V., van der Beelen S. H. E., Merkx M., Anal. Chem. 2016, 88, 4525–4532. - PubMed
Publication types
MeSH terms
Substances
LinkOut - more resources
Full Text Sources
Other Literature Sources
Research Materials
