

NF-κB upregulation through epigenetic silencing of LDOC1 drives tumor biology and specific immunophenotype in Group A ependymoma
- PMID: 28510691
- PMCID: PMC5596179
- DOI: 10.1093/neuonc/nox061
NF-κB upregulation through epigenetic silencing of LDOC1 drives tumor biology and specific immunophenotype in Group A ependymoma
Abstract
Background: Inflammation has been identified as a hallmark of high-risk Group A (GpA) ependymoma (EPN). Chronic interleukin (IL)-6 secretion from GpA tumors drives an immune suppressive phenotype by polarizing infiltrating monocytes. This study determines the mechanism by which IL-6 is dysregulated in GpA EPN.
Methods: Twenty pediatric GpA and 21 pediatric Group B (GpB) EPN had gene set enrichment analysis for MSigDB Hallmark gene sets performed. Protein and RNA from patients and cell lines were used to validate transcriptomic findings. GpA cell lines 811 and 928 were used for in vitro experiments performed in this study.
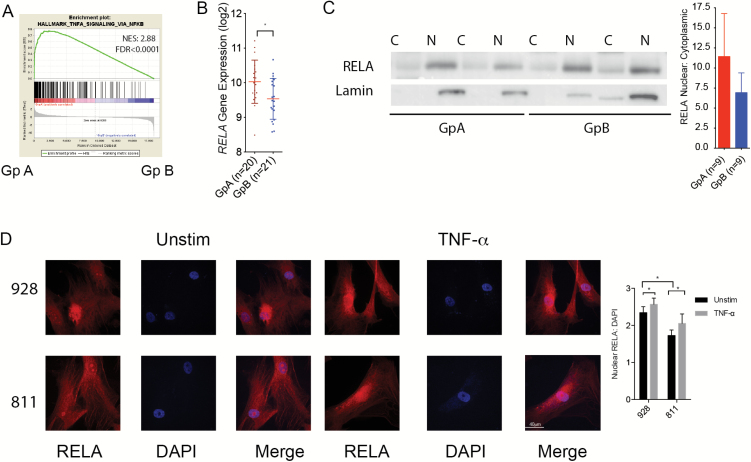
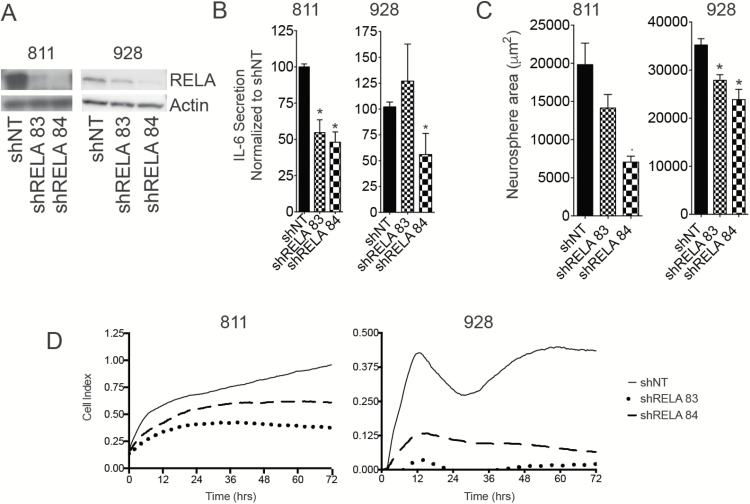
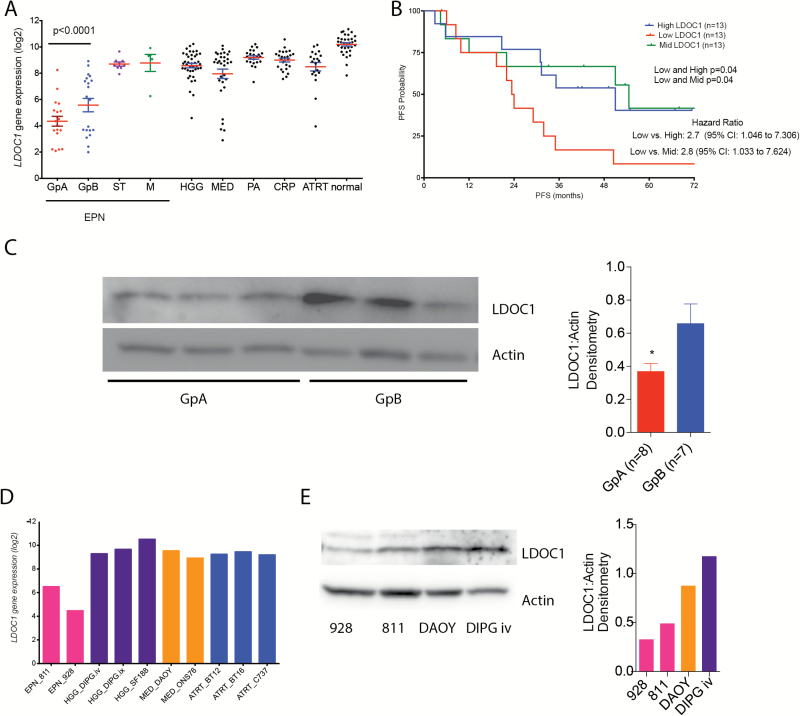
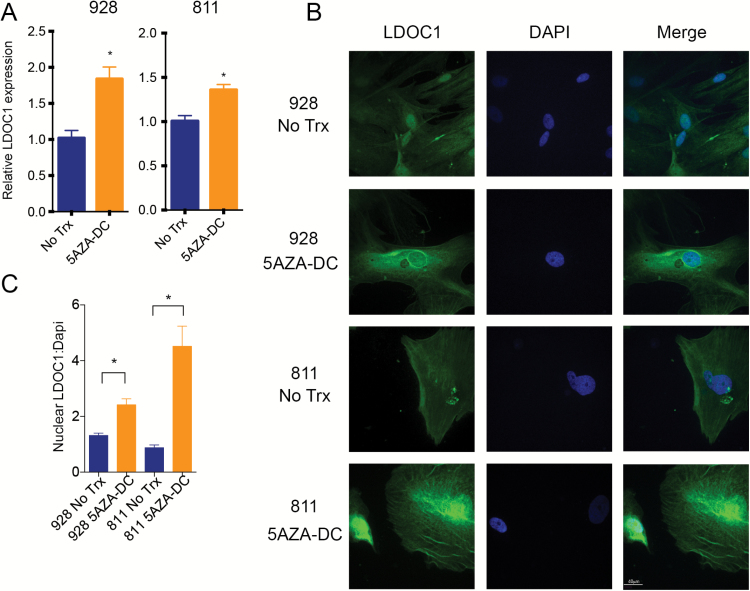
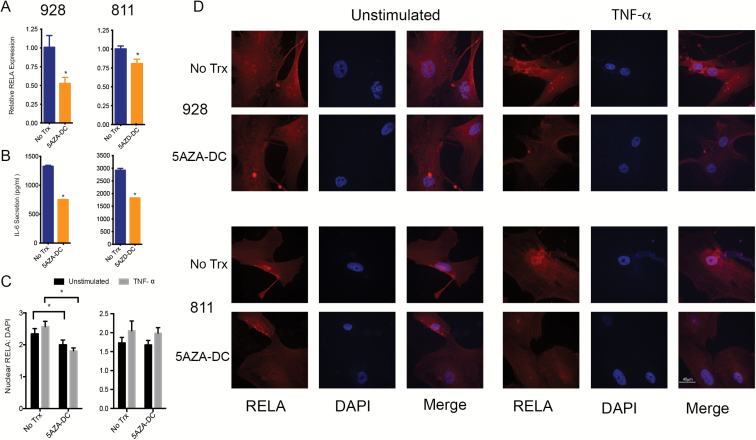
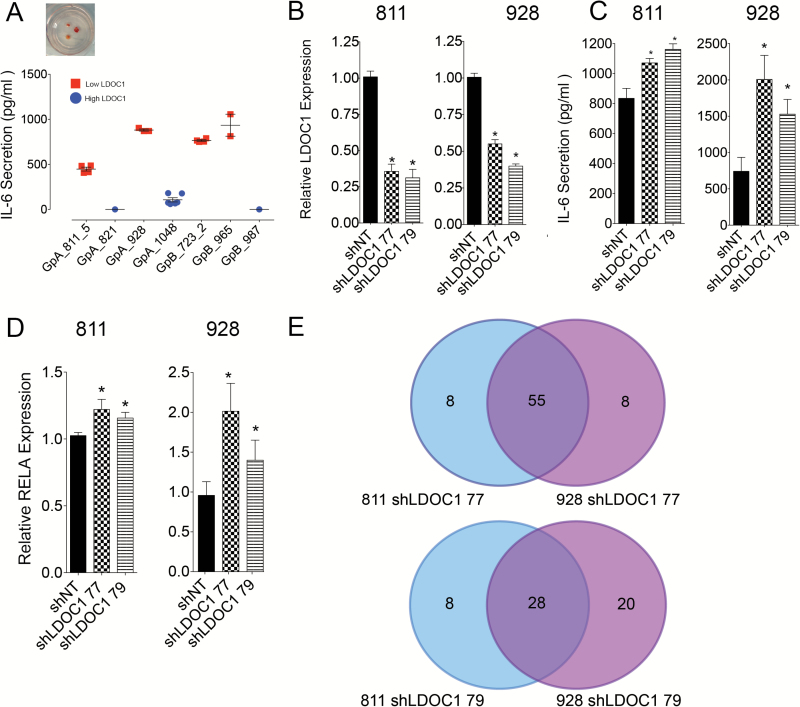
Results: The nuclear factor-kappaB (NF-κB) pathway is a master regulator of IL-6 and a signaling pathway enriched in GpA compared with GpB EPN. Knockdown of NF-κB led to significant downregulation of IL-6 in 811 and 928. NF-κB activation was independent of tumor necrosis factor alpha (TNF-α) stimulation in both cell lines, suggesting that NF-κB hyperactivation is mediated through an alternative mechanism. Leucine zipper downregulated in cancer 1 (LDOC1) is a known transcriptional repressor of NF-κB. In many cancers, LDOC1 promoter is methylated, which inhibits gene transcription. We found decreased LDOC1 gene expression in GpA compared with GpB EPN, and in other pediatric brain tumors. EPN cells treated with 5AZA-DC, demethylated LDOC1 regulatory regions, upregulated LDOC1 expression, and concomitantly decreased IL-6 secretion. Stable knockdown of LDOC1 in EPN cell lines resulted in a significant increase in gene transcription of v-rel avian reticuloendotheliosis viral oncogene homolog A, which correlated to an increase in NF-κB target genes.
Conclusion: These results suggest that epigenetic silencing of LDOC1 in GpA EPN regulates tumor biology and drives inflammatory immune phenotype.
Keywords: LDOC1; NF-κB; ependymoma; inflammation; methylation.
© The Author(s) 2017. Published by Oxford University Press on behalf of the Society for Neuro-Oncology. All rights reserved. For permissions, please e-mail: journals.permissions@oup.com
Figures
Similar articles
-
Loss of LDOC1 by chromatin compaction in mesenchymal tumor cells is required for PFA1 ependymoma growth.Neuro Oncol. 2025 Jul 30;27(6):1597-1610. doi: 10.1093/neuonc/noaf029. Neuro Oncol. 2025. PMID: 39901723 Free PMC article.
-
Overexpression of LDOC1 in human biliary epithelial cells inhibits apoptosis through NF-κB signaling.J Pediatr Gastroenterol Nutr. 2013 Dec;57(6):713-7. doi: 10.1097/MPG.0b013e3182a7e1da. J Pediatr Gastroenterol Nutr. 2013. PMID: 23942005
-
Leucine Zipper Down-regulated in Cancer-1 (LDOC1) interacts with Guanine nucleotide binding protein-like 3-like (GNL3L) to modulate Nuclear Factor-kappa B (NF-κB) signaling during cell proliferation.Cell Cycle. 2016 Dec;15(23):3251-3267. doi: 10.1080/15384101.2016.1242534. Epub 2016 Oct 20. Cell Cycle. 2016. PMID: 27764577 Free PMC article.
-
LDOC1 is differentially expressed in thyroid cancer and display tumor-suppressive function in papillary thyroid carcinoma.Cell Biol Int. 2020 Apr;44(4):985-997. doi: 10.1002/cbin.11295. Epub 2020 Jan 17. Cell Biol Int. 2020. PMID: 31889386
-
Regulation of the MIR155 host gene in physiological and pathological processes.Gene. 2013 Dec 10;532(1):1-12. doi: 10.1016/j.gene.2012.12.009. Epub 2012 Dec 14. Gene. 2013. PMID: 23246696 Review.
Cited by
-
Discriminating Origin Tissues of Tumor Cell Lines by Methylation Signatures and Dys-Methylated Rules.Front Bioeng Biotechnol. 2020 May 26;8:507. doi: 10.3389/fbioe.2020.00507. eCollection 2020. Front Bioeng Biotechnol. 2020. PMID: 32528944 Free PMC article.
-
Loss of LDOC1 by chromatin compaction in mesenchymal tumor cells is required for PFA1 ependymoma growth.Neuro Oncol. 2025 Jul 30;27(6):1597-1610. doi: 10.1093/neuonc/noaf029. Neuro Oncol. 2025. PMID: 39901723 Free PMC article.
-
Specific expression of PD-L1 in RELA-fusion supratentorial ependymoma: Implications for PD-1-targeted therapy.Pediatr Blood Cancer. 2018 May;65(5):e26960. doi: 10.1002/pbc.26960. Epub 2018 Jan 19. Pediatr Blood Cancer. 2018. PMID: 29350470 Free PMC article.
-
Pro-inflammatory cytokines mediate the epithelial-to-mesenchymal-like transition of pediatric posterior fossa ependymoma.Nat Commun. 2022 Jul 8;13(1):3936. doi: 10.1038/s41467-022-31683-9. Nat Commun. 2022. PMID: 35803925 Free PMC article.
-
Molecular Classification and Therapeutic Targets in Ependymoma.Cancers (Basel). 2021 Dec 10;13(24):6218. doi: 10.3390/cancers13246218. Cancers (Basel). 2021. PMID: 34944845 Free PMC article. Review.
References
MeSH terms
Substances
Grants and funding
LinkOut - more resources
Full Text Sources
Other Literature Sources
