

Zoomed MRI Guided by Combined EEG/MEG Source Analysis: A Multimodal Approach for Optimizing Presurgical Epilepsy Work-up and its Application in a Multi-focal Epilepsy Patient Case Study
- PMID: 28510905
- PMCID: PMC5495874
- DOI: 10.1007/s10548-017-0568-9
Zoomed MRI Guided by Combined EEG/MEG Source Analysis: A Multimodal Approach for Optimizing Presurgical Epilepsy Work-up and its Application in a Multi-focal Epilepsy Patient Case Study
Abstract
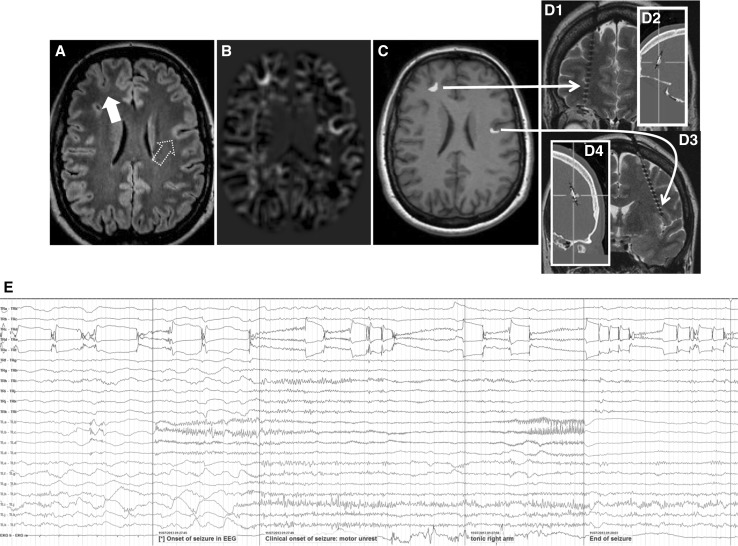
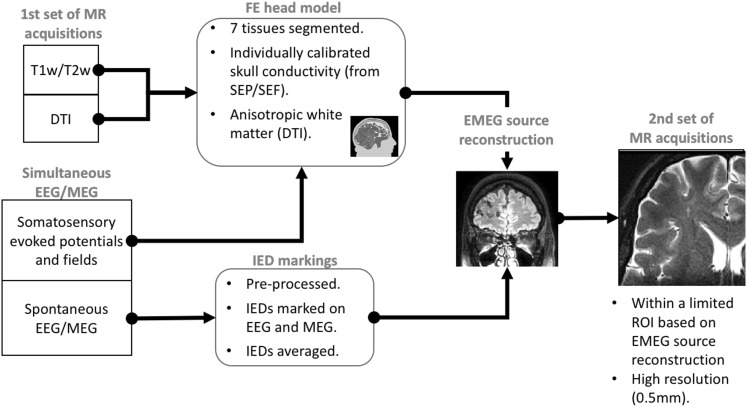
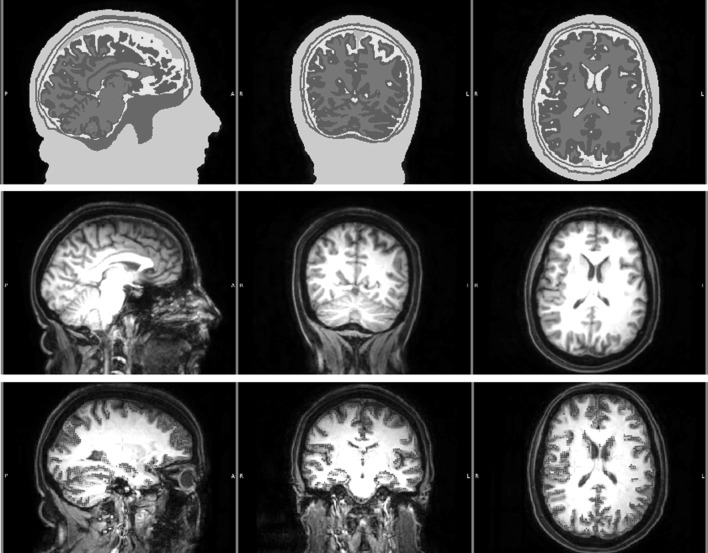
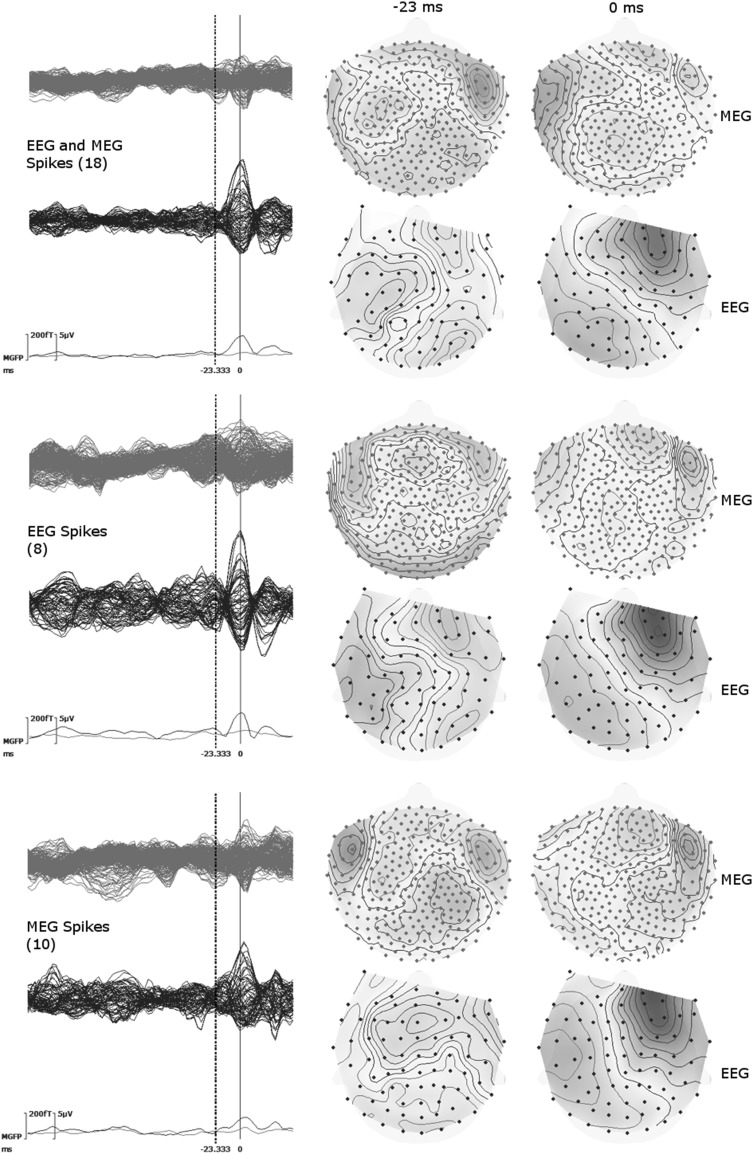
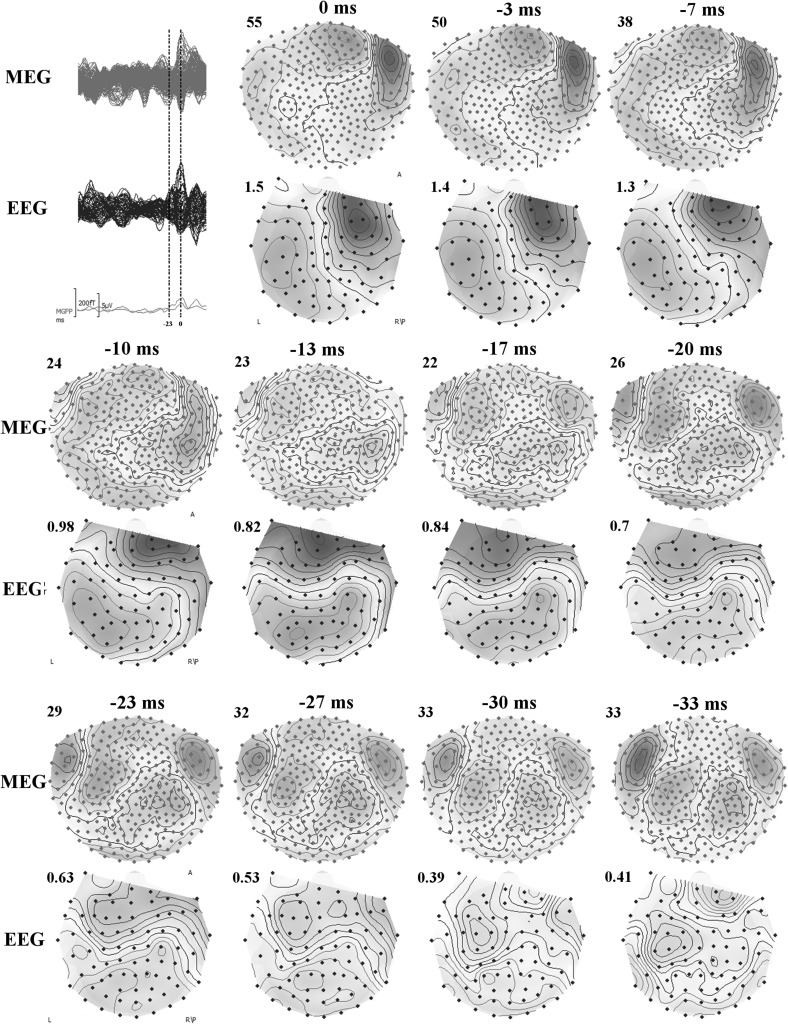
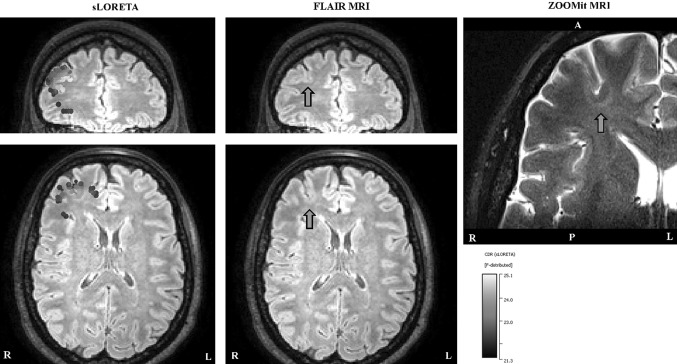
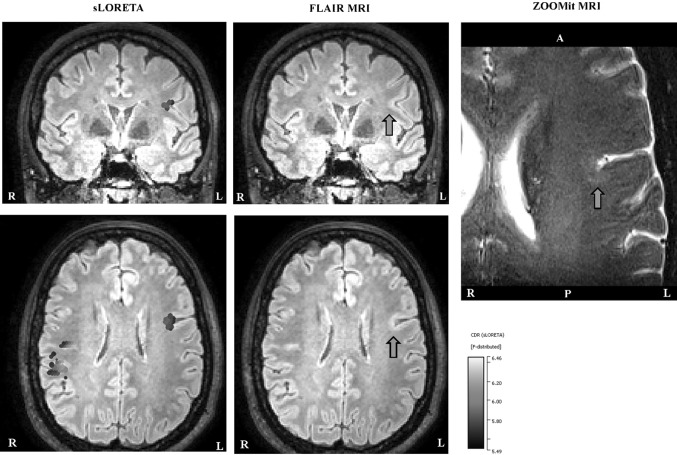
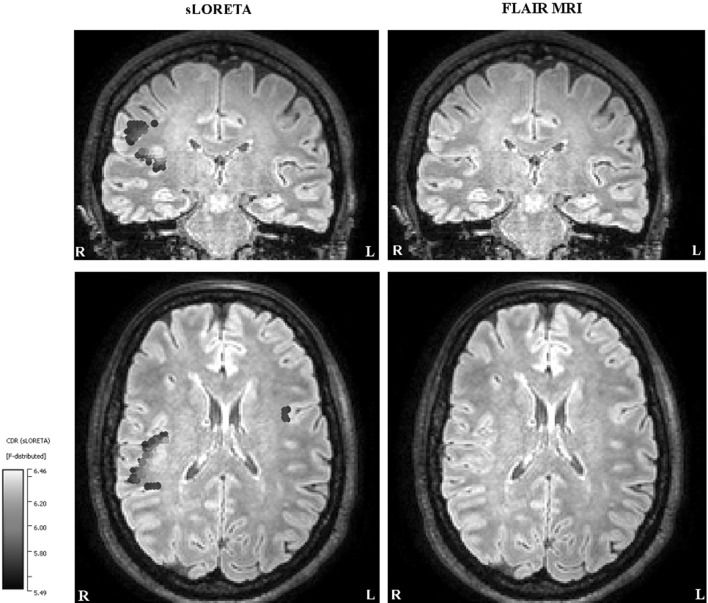
In recent years, the use of source analysis based on electroencephalography (EEG) and magnetoencephalography (MEG) has gained considerable attention in presurgical epilepsy diagnosis. However, in many cases the source analysis alone is not used to tailor surgery unless the findings are confirmed by lesions, such as, e.g., cortical malformations in MRI. For many patients, the histology of tissue resected from MRI negative epilepsy shows small lesions, which indicates the need for more sensitive MR sequences. In this paper, we describe a technique to maximize the synergy between combined EEG/MEG (EMEG) source analysis and high resolution MRI. The procedure has three main steps: (1) construction of a detailed and calibrated finite element head model that considers the variation of individual skull conductivities and white matter anisotropy, (2) EMEG source analysis performed on averaged interictal epileptic discharges (IED), (3) high resolution (0.5 mm) zoomed MR imaging, limited to small areas centered at the EMEG source locations. The proposed new diagnosis procedure was then applied in a particularly challenging case of an epilepsy patient: EMEG analysis at the peak of the IED coincided with a right frontal focal cortical dysplasia (FCD), which had been detected at standard 1 mm resolution MRI. Of higher interest, zoomed MR imaging (applying parallel transmission, 'ZOOMit') guided by EMEG at the spike onset revealed a second, fairly subtle, FCD in the left fronto-central region. The evaluation revealed that this second FCD, which had not been detectable with standard 1 mm resolution, was the trigger of the seizures.
Keywords: Combined EEG/MEG; Epileptic activity; Focal cortical dysplasia type IIb; Realistic finite element head model; Skull conductivity calibration; Source reconstruction; Zoomed MRI.
Figures
Similar articles
-
Interictal and ictal source localization for epilepsy surgery using high-density EEG with MEG: a prospective long-term study.Brain. 2019 Apr 1;142(4):932-951. doi: 10.1093/brain/awz015. Brain. 2019. PMID: 30805596 Free PMC article.
-
EEG and MEG source analysis of single and averaged interictal spikes reveals intrinsic epileptogenicity in focal cortical dysplasia.Epilepsia. 2004 Jun;45(6):621-31. doi: 10.1111/j.0013-9580.2004.56503.x. Epilepsia. 2004. PMID: 15144427
-
Frequency domain beamforming of magnetoencephalographic beta band activity in epilepsy patients with focal cortical dysplasia.Epilepsy Res. 2014 Sep;108(7):1195-203. doi: 10.1016/j.eplepsyres.2014.05.003. Epub 2014 May 13. Epilepsy Res. 2014. PMID: 24907181
-
Utility of MRI, PET, and ictal SPECT in presurgical evaluation of non-lesional pediatric epilepsy.Seizure. 2020 Apr;77:15-28. doi: 10.1016/j.seizure.2019.05.008. Epub 2019 May 11. Seizure. 2020. PMID: 31122814 Free PMC article. Review.
-
Contribution of magnetic source imaging to the presurgical work-up of patients with refractory partial epilepsy.JBR-BTR. 2008 Nov-Dec;91(6):249-53. JBR-BTR. 2008. PMID: 19202999 Review.
Cited by
-
The Discontinuous Galerkin Finite Element Method for Solving the MEG and the Combined MEG/EEG Forward Problem.Front Neurosci. 2018 Feb 2;12:30. doi: 10.3389/fnins.2018.00030. eCollection 2018. Front Neurosci. 2018. PMID: 29456487 Free PMC article.
-
Black Line Sign in Focal Cortical Dysplasia IIB: A 7T MRI and Electroclinicopathologic Study.Neurology. 2022 Aug 9;99(6):e616-e626. doi: 10.1212/WNL.0000000000200702. Epub 2022 May 16. Neurology. 2022. PMID: 35940890 Free PMC article.
-
The effect of stimulation type, head modeling, and combined EEG and MEG on the source reconstruction of the somatosensory P20/N20 component.Hum Brain Mapp. 2019 Dec 1;40(17):5011-5028. doi: 10.1002/hbm.24754. Epub 2019 Aug 9. Hum Brain Mapp. 2019. PMID: 31397966 Free PMC article.
-
Group optimization methods for dose planning in tES.J Neural Eng. 2025 Aug 14;22(4):046045. doi: 10.1088/1741-2552/adf887. J Neural Eng. 2025. PMID: 40769162 Free PMC article.
-
Hippocampal dentate gyrus integrity revealed with ultrahigh resolution diffusion imaging predicts memory performance in older adults.Hippocampus. 2022 Sep;32(9):627-638. doi: 10.1002/hipo.23456. Epub 2022 Jul 15. Hippocampus. 2022. PMID: 35838075 Free PMC article.
References
-
- Allison T, Wood CC, McCarthy G, Spencer DD. Cortical somatosensory evoked potentials. II. Effects of excision of somatosensory or motor cortex in humans and monkeys. J Neurophysiol. 1991;66(1):64–82. - PubMed
Publication types
MeSH terms
LinkOut - more resources
Full Text Sources
Other Literature Sources
