. 2017 May 16;8(3):e00614-17.
doi: 10.1128/mBio.00614-17.

Structure-Based Mutations in the Herpes Simplex Virus 1 Glycoprotein B Ectodomain Arm Impart a Slow-Entry Phenotype

Affiliations

Structure-Based Mutations in the Herpes Simplex Virus 1 Glycoprotein B Ectodomain Arm Impart a Slow-Entry Phenotype

Qing Fan et al. mBio. .

Abstract

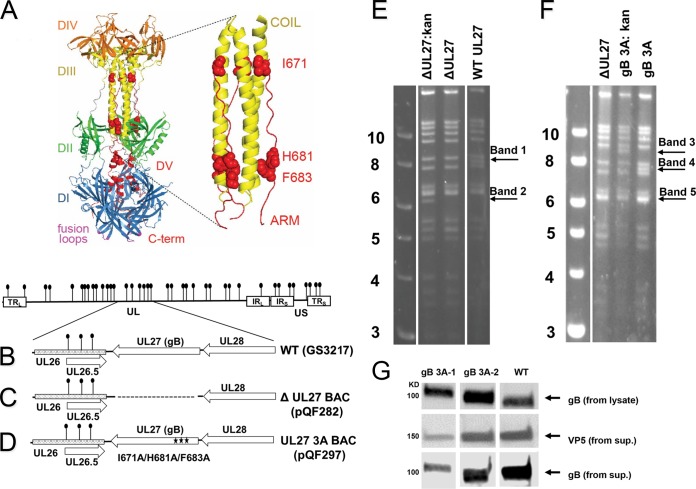
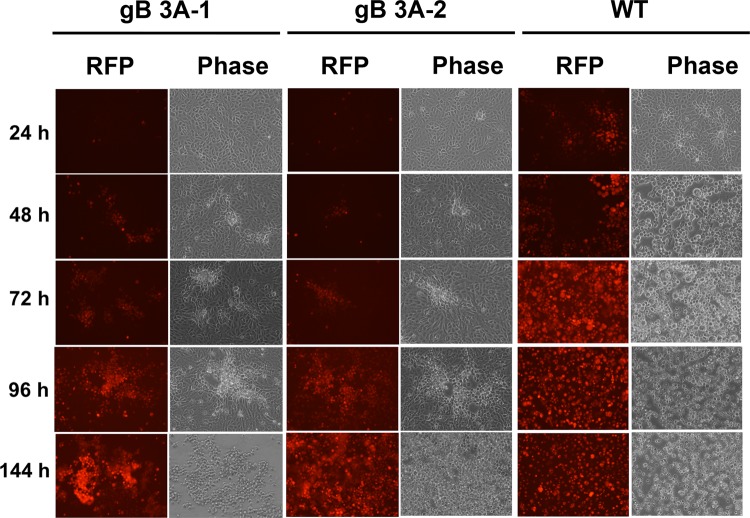
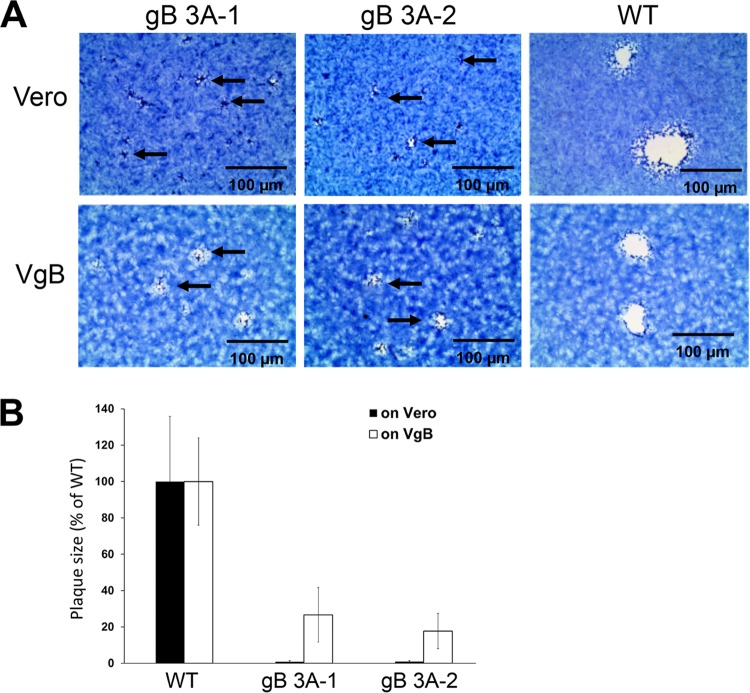
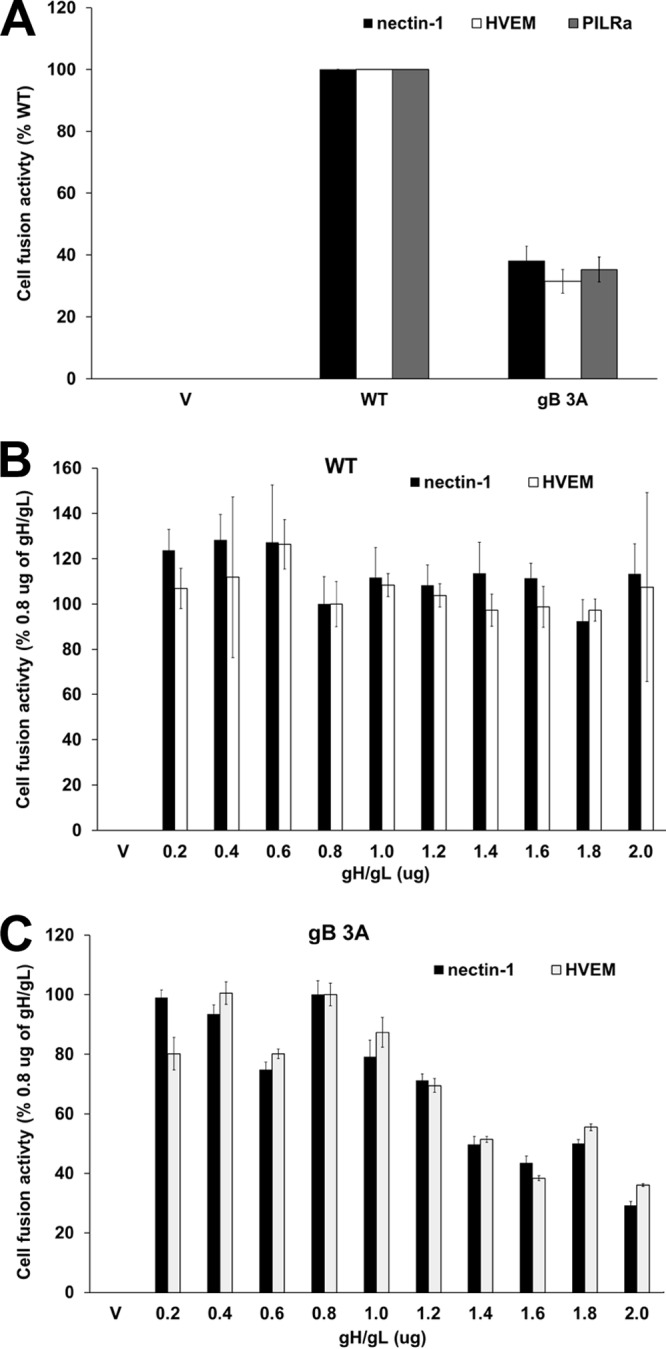
Glycoprotein B (gB) is the conserved herpesvirus fusion protein, and it is required for the entry of herpesviruses. The structure of the postfusion conformation of gB has been solved for several herpesviruses; however, the gB prefusion crystal structure and the details of how the protein refolds from a prefusion to a postfusion form to mediate fusion have not been determined. Using structure-based mutagenesis, we previously reported that three mutations (I671A, H681A, and F683A) in the C-terminal arm of the gB ectodomain greatly reduced cell-cell fusion. This fusion deficit could be rescued by the addition of a hyperfusogenic mutation, suggesting that the gB triple mutant was not misfolded. Using a bacterial artificial chromosome (BAC), we constructed two independent herpes simplex virus 1 mutant strains (gB 3A) carrying the three arm mutations. The gB 3A viruses have 200-fold smaller plaques than the wild-type virus and demonstrate remarkably delayed entry into cells. Single-step and multistep growth curves show that gB 3A viruses have delayed replication kinetics. Interestingly, incubation at 40°C promoted the entry of the gB 3A viruses. We propose that the gB 3A viruses' entry deficit is due to a loss of interactions between residues in the gB C-terminal arm and the coiled-coil core of gB. The results suggest that the triple alanine mutation may destabilize the postfusion gB conformation and/or stabilize the prefusion gB conformation and that exposure to elevated temperatures can overcome the defect in gB 3A viruses.IMPORTANCE Because of its complexity, the mechanism of herpesvirus entry into cells is not well understood. Our study investigated one of the most important unanswered questions about herpesvirus entry; i.e., how does the herpesvirus fusion protein gB mediate membrane fusion? gB is an essential protein that is conserved in all herpesviruses and is thought to undergo a conformational change to provide the energy to fuse the viral and cellular membranes. Using our understanding of the structure of gB, we designed mutations in the gB "arm" region that we predicted would impede gB function. We introduced these mutations into herpes simplex virus 1 by using a bacterial artificial chromosome, and the mutant virus exhibited a drastically delayed rate of entry. This entry defect was rescued by incubation at elevated temperatures, supporting a hypothesis that the engineered mutations altered the energetics of gB refolding. This study supports our hypothesis that an interaction between the gB arm and the core of gB is critical for gB refolding and the execution of membrane fusion, thus providing key details about the function of gB in herpesvirus-mediated fusion and subsequent virus entry.


Figures

FIG 1
FIG 1
Generation of gB 3A viruses. (A) HSV-1 gB ectodomain (PDB ID 2GUM). The five domains (DI to DV) of HSV-1 gB are color coded. The fusion loops (purple) are located on the same side of the molecule as the C-terminal region (red), giving a postfusion hairpin conformation. The domain V arm (red) packs against the coiled-coil core of domain III (yellow) in an antiparallel orientation. A closeup of the coil-arm region is shown, with the three residues that are mutated in gB 3A shown as red spheres. (B) HSV-1 genome with internal repeats (IR) and terminal repeats (TR) shown as white rectangles. BamHI sites are indicated by lollipops. A region of the genome is expanded to show the UL27 open reading frame (gB opening reading frame) and the neighboring UL26 and UL28 open reading frames (arrowheads indicate gene orientation). (C) HSV-1 genome with UL27 (gB) deletion. Dotted lines indicate the UL27 open reading frame deletion in BAC pQF282. (D) gB 3A viruses were made by recombining the gB open reading frame from plasmid pSG5-HSVgB-I671A/H681A/F683A into the gB-null BAC to create BAC pQF297. (E, F) Ethidium bromide-stained agarose gels of BamHI-digested BAC DNA. Digestion of the parental, intermediate, and final BACs generated to create gB-null BAC pQF282 (E) and gB 3A BAC pQF297 (F) are shown. The Kanr cassette is ~1.0 kb and contains one BamHI site. Removal of the Kanr cassette changes the BamHI digestion pattern, as highlighted by the arrows. Samples shown together were run on a single gel, but the lanes were rearranged for clarity. (G) Incorporation of gB into virions. Cells were infected with WT (G3217) or gB 3A viruses and cell lysates or supernatants (sup.) were harvested. Supernatants were pelleted through 10% sucrose. As shown at the top, lysates were separated by SDS-PAGE, blotted, and probed for HSV-1 gB. As shown at the bottom, duplicate supernatant samples were separated by SDS-PAGE, blotted, and probed for VP5 or gB. Samples shown next to one another were run on a single gel, but the lanes were rearranged for clarity. The values to the left of panels E and F identify the kilobase pairs of the DNA ladder.
FIG 2
FIG 2
HSV-1 gB 3A cell infection. Vero cells plated in six-well plates were infected with gB 3A-1, gB 3A-2, or WT (G3217) HSV-1 at an MOI of 0.01. After 24, 48, 72, 96, or 144 h, cells were imaged for the RFP encoded by the virus with an EVOS Cell Imaging System at identical settings under ×20 magnification.
FIG 3
FIG 3
Plaque morphology of gB 3A viruses. Vero or VgB cells (Vero cells that express WT gB) were infected with gB 3A-1, gB 3A-2, or WT (G3217) HSV-1 at an MOI of 0.01. (A) Cells were stained with Giemsa stain 3 days after infection, and plaques were photographed with an EVOS Cell Imaging System at identical settings under ×4 magnification (scale bars, 100 µm). The arrows indicate small plaques. (B) gB 3A and WT plaque sizes on Vero or VgB cells were calculated by measuring the radii of at least 20 plaques from each virus, and the area of each plaque was determined. The gB 3A plaque sizes are presented as a percentage of the WT plaque area on Vero or VgB (gB-expressing) cells.
FIG 4
FIG 4
Analyses of gB 3A virus growth curves. (A) Single-step growth curve. Vero cells in six-well plates were infected with WT (GS3217), gB 3A-1, or gB 3A-2 virus at 5 PFU/cell. At the time points indicated, virus was harvested from total cell lysates. Viral titers were determined by a plaque assay on Vero cells. (B) Multistep growth curve. Vero cells in six-well plates were infected with WT (GS3217), gB 3A-1, or gB 3A-2 virus at 0.01 PFU/cell. At the time points indicated, virus was harvested from total cell lysates. Viral titers were determined by a plaque assay on Vero cells. Both graphs represent the average results of three independent experiments. Error bars indicate standard deviations.
FIG 5
FIG 5
Penetration of cells by gB 3A viruses. (A) Penetration of cells by WT (GS3217) HSV-1. WT virus was added to Vero cell monolayers and incubated at 4°C for 1 h, and then the samples were shifted to 37°C for 20 to 240 min. At the times indicated, infected cells were rinsed with citrate buffer to inactivate extracellular virus or with PBS as a control. A methylcellulose overlay was added to the cells, and infection was quantified by a plaque assay. The data show the average number of plaques from one representative experiment performed in triplicate. (B) Penetration of cells by gB 3A and WT (GS3217) viruses. Vero monolayers in six-well plates were infected with WT, gB 3A-1, or gB 3A-2 virus. After 2 h at 37°C, cells were rinsed with either citric acid buffer or PBS (as a control). A methylcellulose overlay was added to the cells, and infection was quantified by a plaque assay. For each virus, the plaque counts after the citric acid wash are shown as a percentage of the plaque counts of that virus after the PBS rinse (the control). The data shown are from a representative experiment performed in triplicate. (C, D) Penetration of cells by gB 3A viruses. gB 3A-1 viruses (C) or gB 3A-2 viruses (D) were added to Vero cell monolayers in 24-well plates and incubated at 4°C for 1 h. The cells and viruses were shifted to 37°C for 0 to 12 h. At the times indicated, the infected cells were rinsed with citric acid buffer or PBS. A methylcellulose overlay was added to the cells, and the infection was quantified by a plaque assay. The data show the average number of plaques from one representative experiment performed in triplicate.
FIG 6
FIG 6
gB 3A virus binding to cells. WT (GS3217) and gB 3A viruses were diluted to 200 PFU/ml and added to Vero cells in a six-well plate at 4°C or 37°C. Samples were incubated for 0 to 120 min. At the time points indicated, the cells were rinsed twice with PBS to remove unbound virus and a methylcellulose overlay was added. Plaques were visualized with Giemsa stain at 3 days postinfection. For each virus, the level of binding achieved after 60 min of incubation was set to 100%. Normalization was performed independently for each temperature. The data show the plaque counts from one representative experiment performed in triplicate.
FIG 7
FIG 7
Restoration of plaque size by complementation with hyperfusogenic gB. Vero cells were transfected with empty-vector DNA (V) or a plasmid encoding gB 3A or gB 876T. After 24 h, the cells were infected with gB 3A-1 or gB 3A-2 virus for 2 h and overlaid with methylcellulose. Plaques were stained, and the radii of at least 40 randomly selected plaques from each virus were measured to calculate the plaque area. Each data point represents a single plaque.
FIG 8
FIG 8
Penetration of Vero cells by gB 3A viruses at 40°C. gB 3A-1, gB 3A-2, or WT (GS3217) virus was added to Vero cell monolayers in 24-well plates and incubated at 4°C for 1 h. Samples then were shifted to 37°C (A to C) or 40°C (D to F) for 0 to 6 h. Cells were rinsed either with citric acid buffer to inactivate extracellular virus or with PBS as a control. A methylcellulose overlay was added to the cells, and infection was quantified by a plaque assay. The data show the average number of plaques from one representative experiment performed in triplicate.
FIG 9
FIG 9
gB 3A-mediated cell-cell fusion. (A) Cell-cell fusion activity of the WT gB and gB 3A proteins. Target CHO cells were transfected with a reporter plasmid encoding luciferase under the control of the T7 promoter along with a plasmid encoding the PILRα, HVEM, or nectin-1 receptor. Transfected cells were cocultured with effector CHO cells that had been transfected with plasmids encoding T7 polymerase, gD, gH, gL, and either WT gB or gB 3A. After coincubation overnight, luciferase activity was measured as an indication of cell-cell fusion. Background signals (effector cells transfected with the vector only) were subtracted, and the data were normalized to the fusion activity observed with WT gB. Data were normalized separately for each receptor. Each bar shows the mean and standard deviation of three independent experiments. (B, C) Impact of gH/gL levels on fusion mediated by WT gB (B) or gB 3A (C). Target CHO cells were transfected with a reporter plasmid encoding luciferase under the control of the T7 promoter and a plasmid encoding either HVEM or nectin-1. Effector CHO cells were transfected separately with plasmids encoding T7 polymerase, gD, gH, gL, and gB (B) or gB 3A (C). Increasing amounts of gH and gL plasmid DNA were added to the effector cell transfections. Target cells were cocultured with effector cells overnight, and luciferase activity was measured as an indication of cell-cell fusion. Background signals (effector cells transfected with the vector only) were subtracted, and data were normalized to the level of fusion achieved by WT gB in cells transfected with 0.8 µg each of the gH and gL plasmids (standard gH/gL levels). Fusion with each receptor was normalized independently. V denotes empty-vector DNA transfected into the effector cells. Each bar shows the mean and standard deviation of three independent determinations.
FIG 10
FIG 10
Hypothetical models of gB refolding energetics. Although gB refolding likely progresses through several intermediate conformations, only the prefusion and postfusion conformation energy states are depicted. The hypothetical impact of the gB 3A mutations on these states is shown in red. Comparisons of energy of activation (EA) are shown as vertical lines. (A) The 3A mutations may stabilize the gB prefusion conformation, thereby increasing the EA required to trigger gB and reducing gB fusion capacity. (B) The 3A mutations may increase the EA required to achieve an intermediate conformation of gB, such as a prehairpin intermediate, thereby reducing the gB fusion capacity. (C) By decreasing the affinity of the arm for the coil, the 3A mutations may destabilize the postfusion gB, thereby reducing the EA required to move from a postfusion to a prefusion conformation. At equilibrium, this would increase the proportion of the gB population in a prefusion state.

Similar articles

Cited by

References

    1. Connolly SA, Jackson JO, Jardetzky TS, Longnecker R. 2011. Fusing structure and function: a structural view of the herpesvirus entry machinery. Nat Rev Microbiol 9:369–381. doi:10.1038/nrmicro2548. - DOI - PMC - PubMed
    1. Eisenberg RJ, Atanasiu D, Cairns TM, Gallagher JR, Krummenacher C, Cohen GH. 2012. Herpesvirus fusion and entry: a story with many characters. Viruses 4:800–832. doi:10.3390/v4050800. - DOI - PMC - PubMed
    1. Stampfer SD, Heldwein EE. 2013. Stuck in the middle: structural insights into the role of the gH/gL heterodimer in herpesvirus entry. Curr Opin Virol 3:13–19. doi:10.1016/j.coviro.2012.10.005. - DOI - PMC - PubMed
    1. Montgomery RI, Warner MS, Lum BJ, Spear PG. 1996. Herpes simplex virus-1 entry into cells mediated by a novel member of the TNF/NGF receptor family. Cell 87:427–436. doi:10.1016/S0092-8674(00)81363-X. - DOI - PubMed
    1. Cocchi F, Menotti L, Mirandola P, Lopez M, Campadelli-Fiume G. 1998. The ectodomain of a novel member of the immunoglobulin subfamily related to the poliovirus receptor has the attributes of a bona fide receptor for herpes simplex virus types 1 and 2 in human cells. J Virol 72:9992–10002. - PMC - PubMed

Publication types

Substances

LinkOut - more resources