

A genome-wide association meta-analysis on lipoprotein (a) concentrations adjusted for apolipoprotein (a) isoforms
- PMID: 28512139
- PMCID: PMC5580897
- DOI: 10.1194/jlr.M076232
A genome-wide association meta-analysis on lipoprotein (a) concentrations adjusted for apolipoprotein (a) isoforms
Abstract
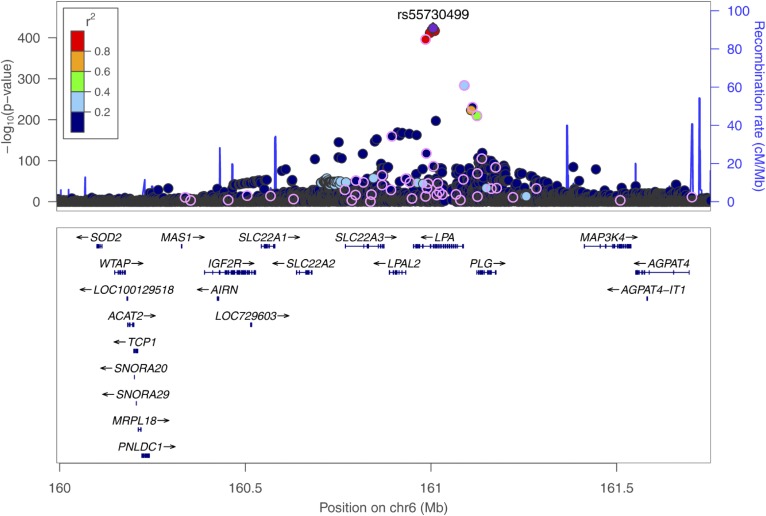
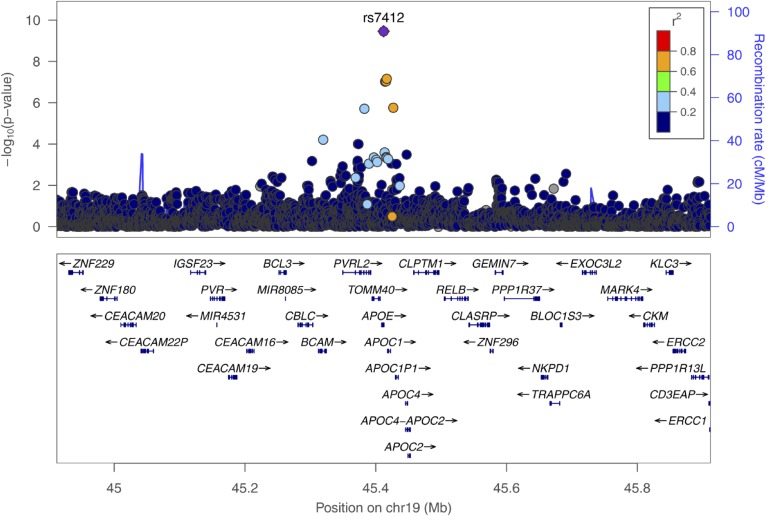
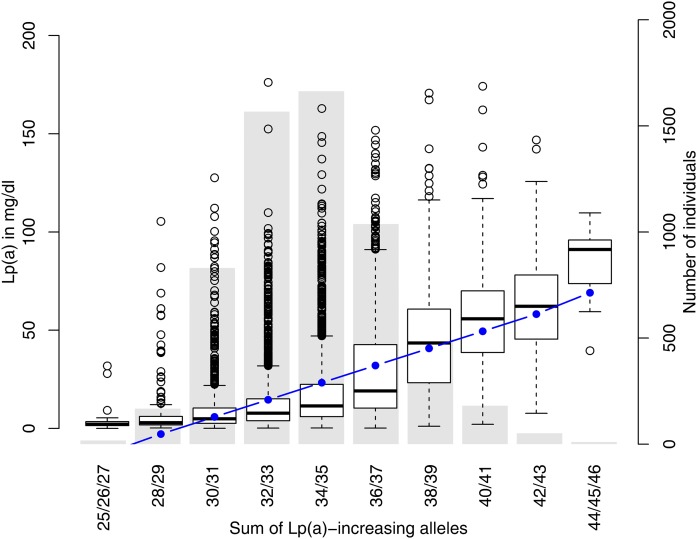
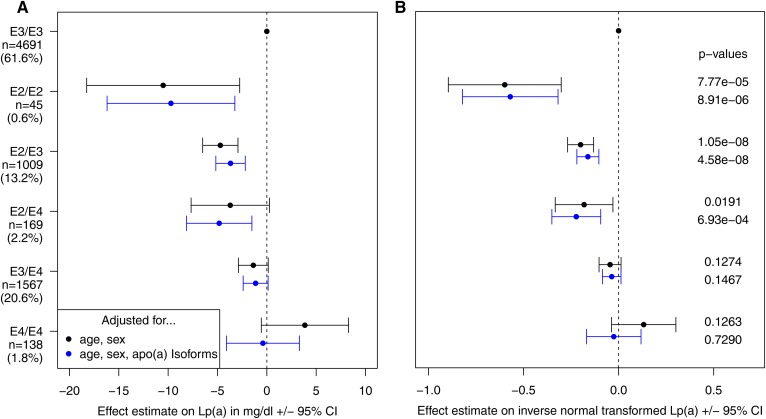
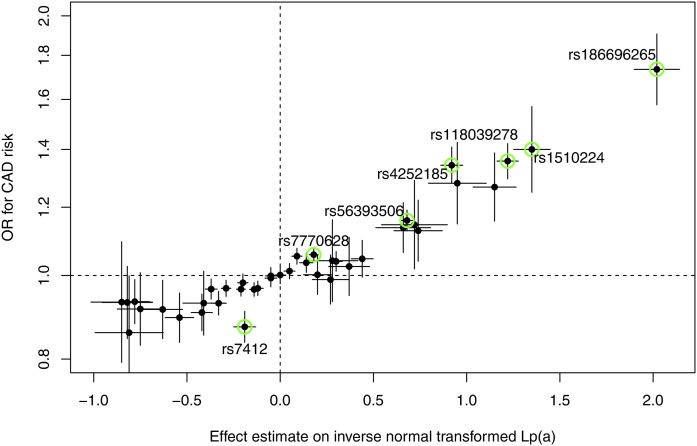
High lipoprotein (a) [Lp(a)] concentrations are an independent risk factor for cardiovascular outcomes. Concentrations are strongly influenced by apo(a) kringle IV repeat isoforms. We aimed to identify genetic loci associated with Lp(a) concentrations using data from five genome-wide association studies (n = 13,781). We identified 48 independent SNPs in the LPA and 1 SNP in the APOE gene region to be significantly associated with Lp(a) concentrations. We also adjusted for apo(a) isoforms to identify loci affecting Lp(a) levels independently from them, which resulted in 31 SNPs (30 in the LPA, 1 in the APOE gene region). Seven SNPs showed a genome-wide significant association with coronary artery disease (CAD) risk. A rare SNP (rs186696265; MAF ∼1%) showed the highest effect on Lp(a) and was also associated with increased risk of CAD (odds ratio = 1.73, P = 3.35 × 10⁻³⁰). Median Lp(a) values increased from 2.1 to 91.1 mg/dl with increasing number of Lp(a)-increasing alleles. We found the APOE2-determining allele of rs7412 to be significantly associated with Lp(a) concentrations (P = 3.47 × 10⁻¹⁰). Each APOE2 allele decreased Lp(a) by 3.34 mg/dl corresponding to ∼15% of the population's mean values. Performing a gene-based test of association, including suspected Lp(a) receptors and regulators, resulted in one significant association of the TLR2 gene with Lp(a) (P = 3.4 × 10⁻⁴). In summary, we identified a large number of independent SNPs in the LPA gene region, as well as the APOE2 allele, to be significantly associated with Lp(a) concentrations.
Keywords: coronary artery disease; epidemiology; genetics.
Copyright © 2017 by the American Society for Biochemistry and Molecular Biology, Inc.
Figures
Comment in
-
Lipoprotein(a): the common, likely causal, yet elusive risk factor for cardiovascular disease.J Lipid Res. 2017 Sep;58(9):1731-1732. doi: 10.1194/jlr.C079111. Epub 2017 Jul 11. J Lipid Res. 2017. PMID: 28698209 Free PMC article. No abstract available.
References
-
- Kronenberg F., and Utermann G.. 2013. Lipoprotein(a): resurrected by genetics. J. Intern. Med. 273: 6–30. - PubMed
-
- Kraft H. G., Köchl S., Menzel H. J., Sandholzer C., and Utermann G.. 1992. The apolipoprotein (a) gene: a transcribed hypervariable locus controlling plasma lipoprotein (a) concentration. Hum. Genet. 90: 220–230. - PubMed
Publication types
MeSH terms
Substances
Grants and funding
LinkOut - more resources
Full Text Sources
Other Literature Sources
Miscellaneous
