. 2017 May 30;114(22):E4452-E4461.
doi: 10.1073/pnas.1620631114. Epub 2017 May 16.

Loss of the homologous recombination gene rad51 leads to Fanconi anemia-like symptoms in zebrafish

Affiliations

Loss of the homologous recombination gene rad51 leads to Fanconi anemia-like symptoms in zebrafish

Jan Gregor Botthof et al. Proc Natl Acad Sci U S A. .

Abstract

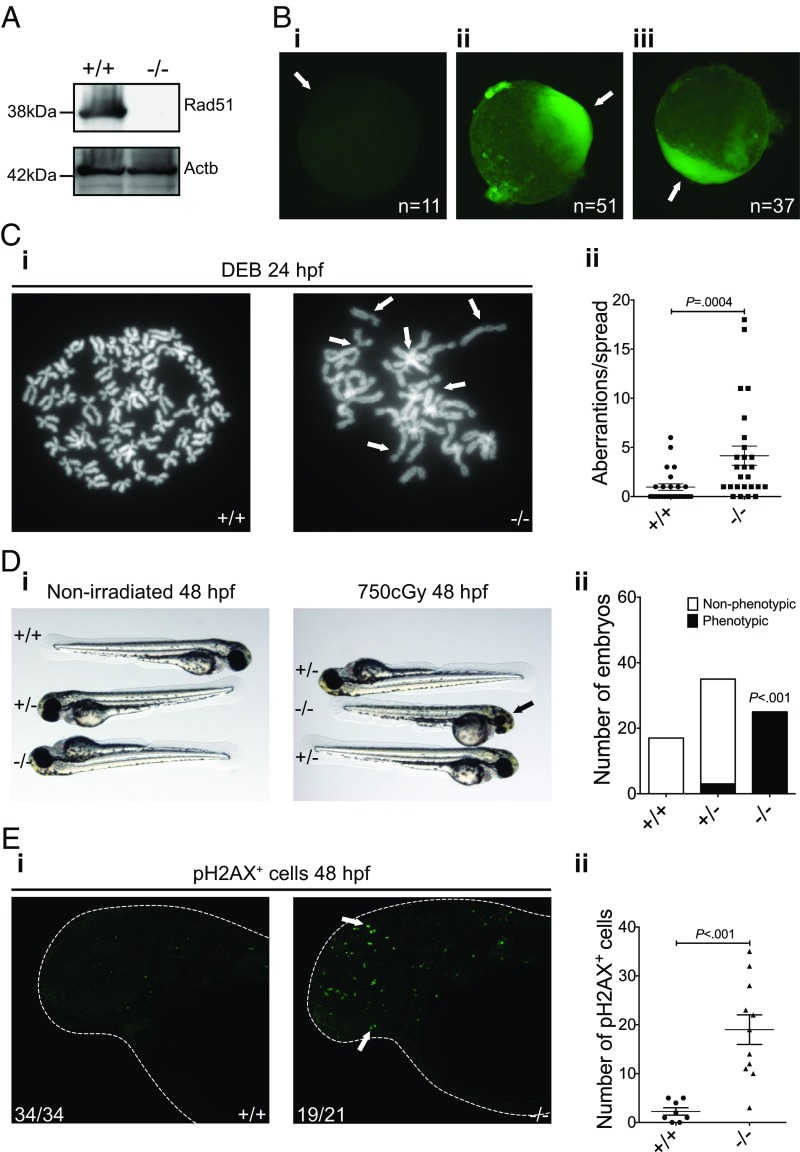
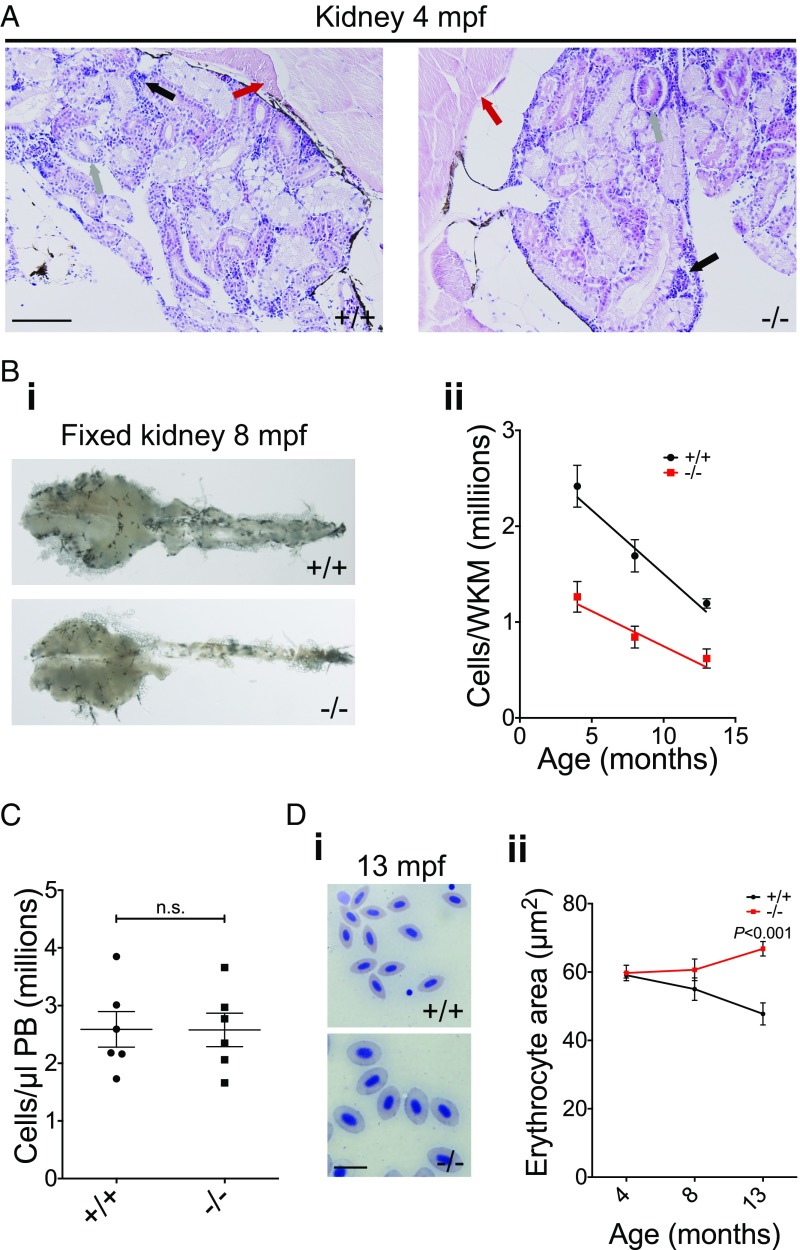
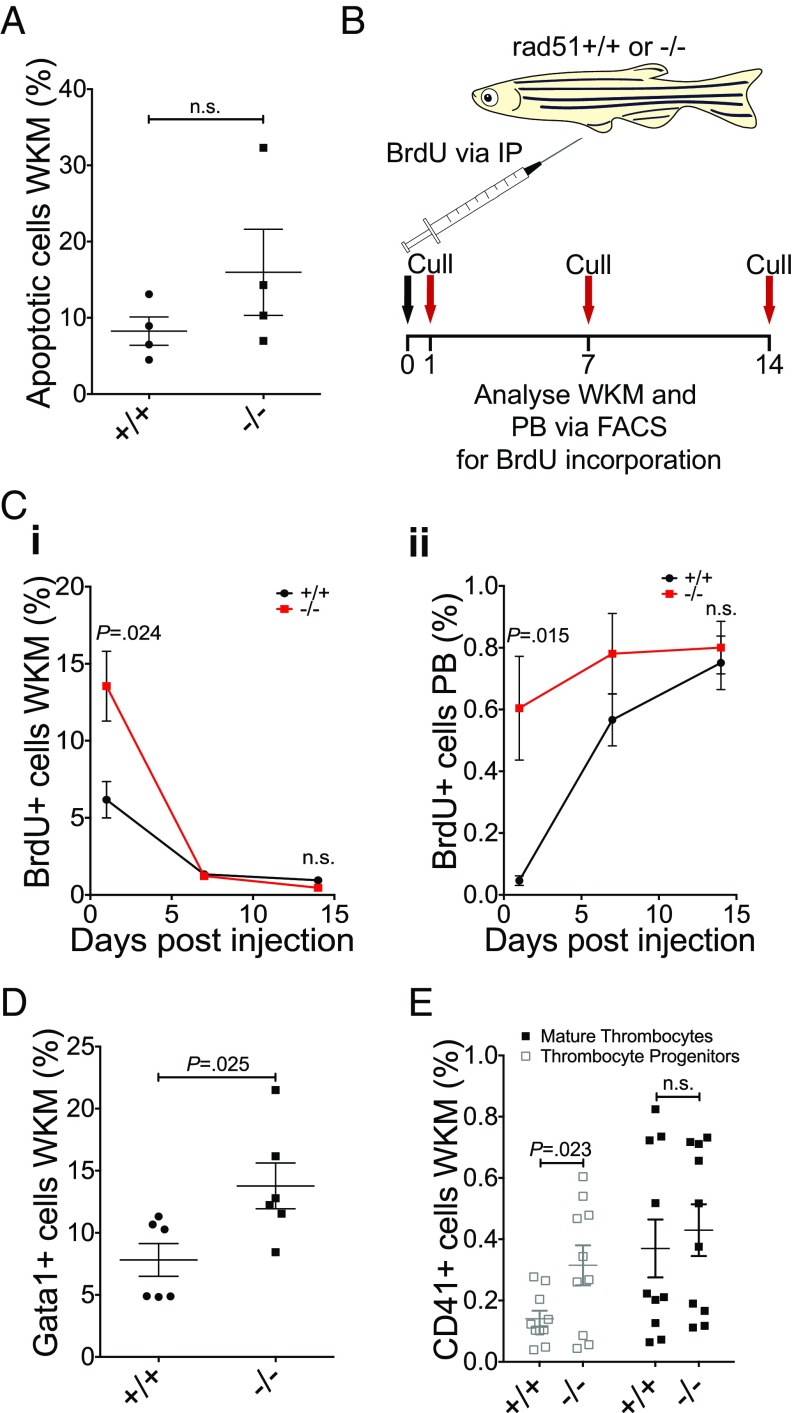
RAD51 is an indispensable homologous recombination protein, necessary for strand invasion and crossing over. It has recently been designated as a Fanconi anemia (FA) gene, following the discovery of two patients carrying dominant-negative mutations. FA is a hereditary DNA-repair disorder characterized by various congenital abnormalities, progressive bone marrow failure, and cancer predisposition. In this report, we describe a viable vertebrate model of RAD51 loss. Zebrafish rad51 loss-of-function mutants developed key features of FA, including hypocellular kidney marrow, sensitivity to cross-linking agents, and decreased size. We show that some of these symptoms stem from both decreased proliferation and increased apoptosis of embryonic hematopoietic stem and progenitor cells. Comutation of p53 was able to rescue the hematopoietic defects seen in the single mutants, but led to tumor development. We further demonstrate that prolonged inflammatory stress can exacerbate the hematological impairment, leading to an additional decrease in kidney marrow cell numbers. These findings strengthen the assignment of RAD51 as a Fanconi gene and provide more evidence for the notion that aberrant p53 signaling during embryogenesis leads to the hematological defects seen later in life in FA. Further research on this zebrafish FA model will lead to a deeper understanding of the molecular basis of bone marrow failure in FA and the cellular role of RAD51.

Keywords: Fanconi anemia; cytokine effects; hematopoiesis; inflammation; stem cells.


Conflict of interest statement

The authors declare no conflict of interest.

Figures

Fig. 1.
Fig. 1.
The rad51sa23805 allele leads to loss of Rad51 protein and causes DNA damage sensitivity. (A) Western blot showing the expression of Rad51 in testes extracts of WT and mutant zebrafish. β-Actin was used as a loading control. (B) Representative Rad51 immunostained embryos derived from a rad51+/− in-cross. Secondary only (i), Abcam primary (ii), AnaSpec primary (iii). (Magnification, 65×.) (C) Chromosome spreads of 24-hpf WT and mutant embryos treated with 1 µg/mL DEB for 20 h taken using a 100× oil-immersion objective. White arrows indicate characteristic damage (chromosome breaks and radial structures) in response to cross-linking agents (i). Quantification of the damage (ii). Mann–Whitney test, P = 0.0004, n+/+ = 25, n−/− = 26. (D) Comparison of the response of 48-hpf WT and mutant embryos to irradiation (i). (Magnification, 15×.) The black arrow indicates the small head and eye phenotype, which is quantified in ii. Two-tailed Fisher’s exact test pooling WT and heterozygotes as control group, P < 0.001, n = 67. (E) Immunostaining for pH2AX in WT and mutant embryos with pictures of representative embryos taken with a 63× water-immersion objective (i) and quantification of foci (ii). White arrows indicate example foci. Two-tailed Student’s t test, P < 0.0001, n+/+ = 8, n−/− = 11.
Fig. 2.
Fig. 2.
Adult rad51 mutant fish display kidney marrow cytopenia. (A) H&E-stained histological sections of 4-mpf WT and mutant kidneys using a 20× objective. Muscle (red arrow), ducts/tubules (gray arrow), and hematopoietic kidney marrow (black arrow) can be seen. (Scale bar, 100 µm.) (B) Fixed 8-mpf WT and mutant kidneys (i) (magnification, 10×); quantification of the number of total cells per freshly isolated kidney at different ages using a hemocytometer (ii). Two-way ANOVA was used and type III model fit [Armitage et al. (73)]. The test shows a significant influence of age [F(1, 50) = 18.23, P < 0.0001] and mutation status [F(1, 50) = 10.87, P = 0.0018] on phenotype. Four months postfertilization n+/+ = 6, n−/− = 6; 8 mpf n+/+ = 16, n−/− = 16; 13 mpf n+/+ = 6, n−/− = 4. (C) Quantification of PB cells in WT and mutant fish at 4 mpf. Two-sided t test, n+/+ = 6, n−/− = 6. n.s., not significant. (D) In i, blood smears of 13-mpf WT (Upper) and mutant fish (Lower) are compared. (Scale bar, 10 µm.) In ii, the change is quantified using two-way ANOVA and a type III model fit [Armitage et al. (73)]. There was a statistically significant interaction between age and mutation status [F(1, 28) = 12.89, P = 0.0012], no significant influence of age [F(1, 28) = 180.76, P = 0.392] and no significant influence of mutation status [F(1, 28) = 2.88, P = 0.1006]. P value shown on the graph stems from a post hoc Tukey multiple-comparison test. Four months postfertilization: n+/+ = 6, n−/− = 6; 8 mpf: n+/+ = 5, n−/− = 5; 13 mpf: n+/+ = 6, n−/− = 4. Bars represent mean ± SEM.
Fig. 3.
Fig. 3.
HSPCs in the kidney adult rad51 mutant fish show increased proliferation. (A) AV-PI assay to assess apoptosis in the kidney. Two-sided t test, n+/+ = 4, n−/− = 4. (B) Schematic of the experimental design for the BrdU incorporation experiments. Fish were injected once with 10 mg/mL BrdU and culled after 1, 7, or 14 d to obtain the blood and kidney marrow for antibody staining and FACS analysis. (C) Percentage of BrdU+ cells in the kidney (i). Two-sided Student’s t test, P = 0.024 at 1 d postinfection (dpi) and P > 0.05 at 14 dpi; 1 dpi n+/+ = 5, n−/− = 6; 7 dpi n+/+ = 6, n−/− = 6; 14 dpi n+/+ = 5, n−/− = 5. Percentage of BrdU+ cells in the peripheral blood (ii). Two-sided Student’s t test, P = 0.0015 at 1 dpi and P > 0.05 at 14 dpi; 1 dpi n+/+ = 5, n−/− = 6; 7 dpi n+/+ = 6, n−/− = 5; 14 dpi n+/+ = 5, n−/− =5. (D) Percentage of gata1:GFP+ cells in the kidney at 4 mpf. Two-sided Student’s t test, P = 0.025, n+/+ = 6, n−/− = 6. (E) Percentage of dim and bright cd41:GFP+ cells in the kidney at 4 mpf, labeling thrombocytic progenitors, and mature thrombocytes, respectively. Two-tailed Student’s t test. Thrombocytic progenitors: P = 0.023, mature thrombocytes: P = not significant, n+/+ = 10, n−/− = 10. Bars represent mean ± SEM in all graphs; n.s., not significant.
Fig. 4.
Fig. 4.
The rad51sa23805 HSPC defect starts during embryonic development. (A) ISH using a cmyb-specific probe at 2 dpf; the arrow shows HSPCs. Representative images of the three different staining categories are shown (i) and a quantification of the different genotypes (ii) n = 119 from two clutches. (B) ISH using a cmyb-specific probe at 4 dpf; the arrow shows HSPCs. Representative images of the three different staining categories are shown (i) and a quantification of the different genotypes (ii), n = 120 from two clutches. (C) Quantification of BrdU+ cells in the tail at 2 dpf. Two-sided Student’s t test, P = 0.042, n+/+ = 3, n−/− = 3. (D) Quantification of BrdU+ cells in the CHT at 4 dpf. Two-sided Student’s t test, n+/+ = 4, n−/− = 4. Bars represent mean ± SEM in C and D. n.s., not significant. (E) Representative images of TUNEL-stained 2 dpf embryos from a rad51+/− in-cross. Dotted lines indicate the area of the CHT that was scored. Arrows indicate TUNEL+ cells. (F) Quantification of three clutches of TUNEL-stained 2 dpf rad51+/− in-crosses. Each clutch was scored blindly and consisted of 10+/+ and 10−/− embryos each. Shown is the mean of all clutches ± SEM. (Magnification, 100× in all images.)
Fig. 5.
Fig. 5.
The HSPC defects in rad51sa23805 fish are rescued in a p53 mutant background. (A) Representative images of 4-dpf embryos resulting from in-crosses of p53+/− rad51+/− parents stained using a cmyb-specific probe. The total number of embryos used (all genotypes) n = 237 from four clutches. For information about all genotypes, see SI Appendix, Table S3. Arrows indicate HSPCs. (Magnification, 100×.) (B) Percentage of BrdU+ cells in the kidney at 4 mpf at 1 dpi. Two-sided Student’s t test, np53+/+ rad51+/+ = 5, np53−/− rad51−/− = 5. (C) Number of total cells per kidney at 4 mpf quantified using a hemocytometer. Analysis using one-way ANOVA [F(3, 43) = 10.45, P < 0.0001], individual P values shown in the figure are from Tukey’s post hoc test, np53+/+ rad51+/+ = 16, np53+/+ rad51−/− = 16, np53−/− rad51+/+ = 6, np53−/− rad51−/− = 8. Bars represent mean ± SEM in B and C; n.s., not significant.
Fig. 6.
Fig. 6.
Lack of Rad51 causes increased sensitivity to prolonged inflammatory stress. (A) Schematic of the experimental design. Both WT and rad51−/− fish were injected every 7 d with 10 µL 10 mg/mL pI:pC acid, four injections in total. All fish were culled 3 d after the last injection. Control fish were not injected; Rad51+/+, nnoninjected = 10, ninjected = 9; Rad51−/−, nnoninjected = 8, ninjected = 9. (B) Absolute number of cells belonging to different blood lineages in the kidney gained by combining FACS data with the cell counts shown in A. Statistical tests were carried out individually for each cell type, using two-way ANOVA. P value shown on the graph stems from a post hoc Šidak multiple-comparison test, comparing noninjected to injected fish within each genotype. For all groups, n is the same as in A. (C) The total number of cells in the kidney in injected and noninjected fish. Two-way ANOVA was carried out on the reciprocal of the data to fulfill the requirement of homoscedasticity as measured by Bartlett’s test (before transformation: P = 0.0002, after transformation: P = 0.095). There was a statistically significant effect of mutation status [F(1, 32) = 29.86, P < 0.0001] and of injection status [F(1, 32) = 6.778, P = 0.014]. P value shown on the graph stems from a post hoc Tukey multiple-comparison test. For all groups, n is the same as in A. (D) Viable cells as determined by PI-staining. Two-way ANOVA revealed a significant influence of injection status [F(1, 32) = 100.1, P < 0.0001]. P values on the graph stem from a post hoc Tukey multiple-comparison test. Bars represent mean ± SEM in B–D. (E) Percentage of BrdU+ cells in the WKM of WT and mutant (KO) fish in response to pI:pC. 1I, one injection; 2I, two injections; 4I, four injections. (F) Relative expression of genes linked to apoptosis and proliferation. (i) p53. P value shown on the graph stems from a post hoc Tukey multiple-comparison test. (ii) p21. Bars represent geometric mean ± 95% CI in E and F.

References

    1. Shimamura A, Alter BP. Pathophysiology and management of inherited bone marrow failure syndromes. Blood Rev. 2010;24:101–122. - PMC - PubMed
    1. Park JY, et al. Complementation of hypersensitivity to DNA interstrand crosslinking agents demonstrates that XRCC2 is a Fanconi anaemia gene. J Med Genet. 2016;53:672–680. - PMC - PubMed
    1. Bluteau D, et al. Biallelic inactivation of REV7 is associated with Fanconi anemia. J Clin Invest. 2016;126:3580–3584. - PMC - PubMed
    1. Deans AJ, West SC. DNA interstrand crosslink repair and cancer. Nat Rev Cancer. 2011;11:467–480. - PMC - PubMed
    1. Kim H, D’Andrea AD. Regulation of DNA cross-link repair by the Fanconi anemia/BRCA pathway. Genes Dev. 2012;26:1393–1408. - PMC - PubMed

Publication types