. 2017 Jul 1;77(13):3502-3512.
doi: 10.1158/0008-5472.CAN-16-2745. Epub 2017 May 16.

Engineering and Functional Characterization of Fusion Genes Identifies Novel Oncogenic Drivers of Cancer

Affiliations

Engineering and Functional Characterization of Fusion Genes Identifies Novel Oncogenic Drivers of Cancer

Hengyu Lu et al. Cancer Res. .

Abstract

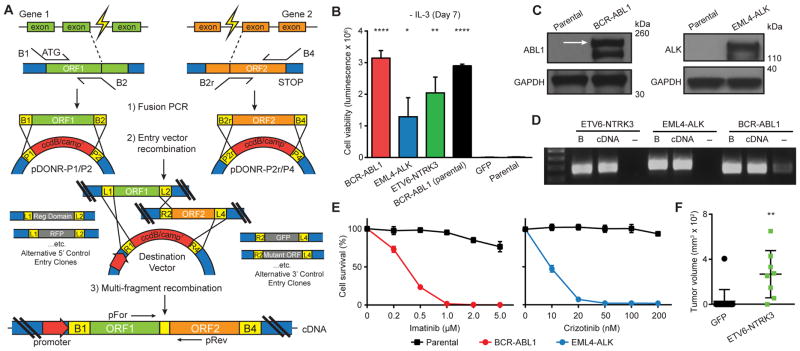
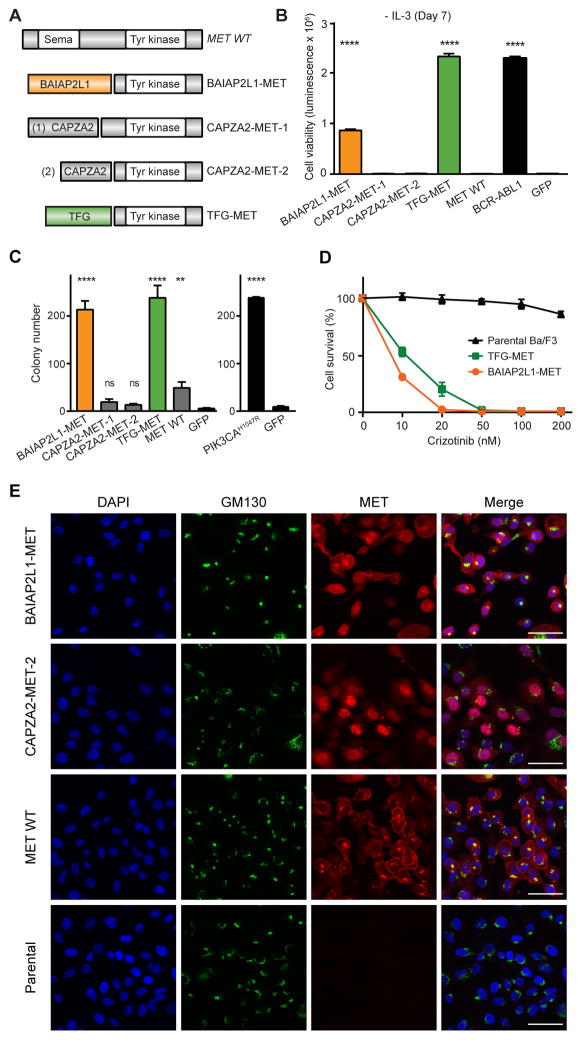
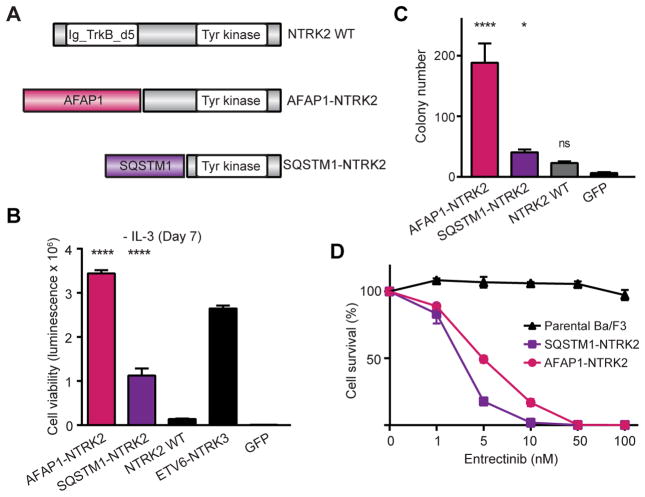
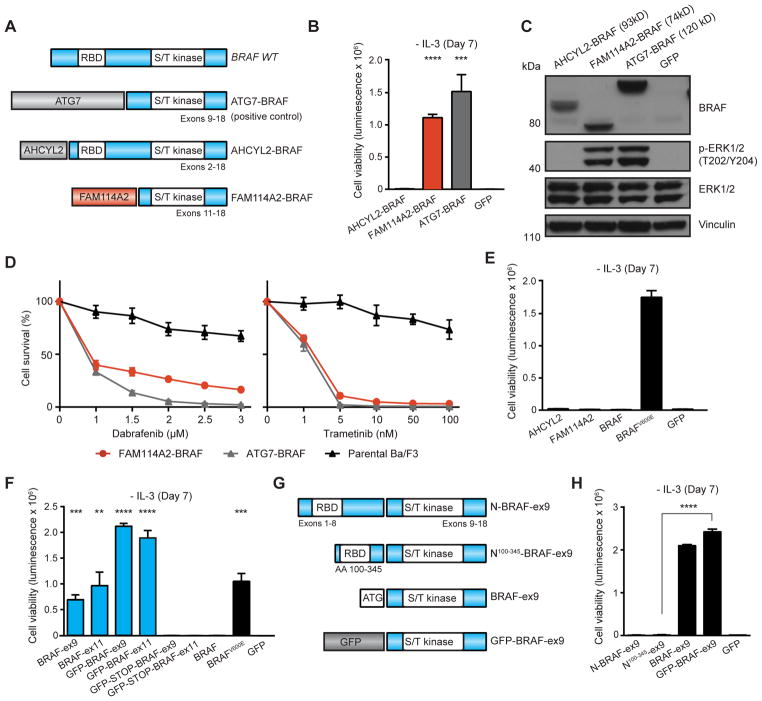
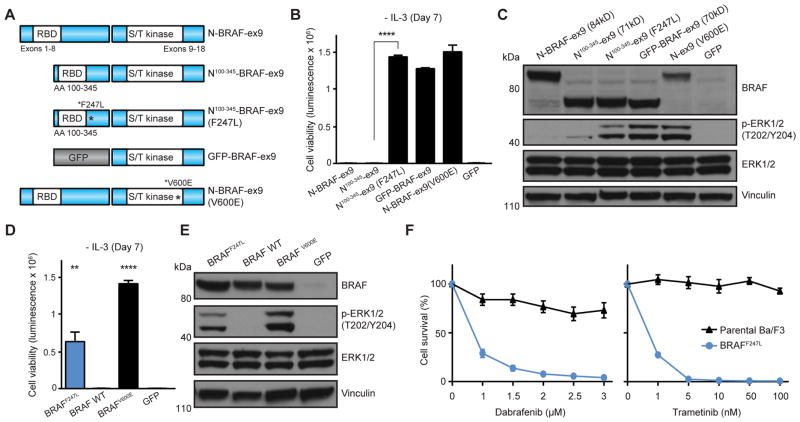
Oncogenic gene fusions drive many human cancers, but tools to more quickly unravel their functional contributions are needed. Here we describe methodology permitting fusion gene construction for functional evaluation. Using this strategy, we engineered the known fusion oncogenes, BCR-ABL1, EML4-ALK, and ETV6-NTRK3, as well as 20 previously uncharacterized fusion genes identified in The Cancer Genome Atlas datasets. In addition to confirming oncogenic activity of the known fusion oncogenes engineered by our construction strategy, we validated five novel fusion genes involving MET, NTRK2, and BRAF kinases that exhibited potent transforming activity and conferred sensitivity to FDA-approved kinase inhibitors. Our fusion construction strategy also enabled domain-function studies of BRAF fusion genes. Our results confirmed other reports that the transforming activity of BRAF fusions results from truncation-mediated loss of inhibitory domains within the N-terminus of the BRAF protein. BRAF mutations residing within this inhibitory region may provide a means for BRAF activation in cancer, therefore we leveraged the modular design of our fusion gene construction methodology to screen N-terminal domain mutations discovered in tumors that are wild-type at the BRAF mutation hotspot, V600. We identified an oncogenic mutation, F247L, whose expression robustly activated the MAPK pathway and sensitized cells to BRAF and MEK inhibitors. When applied broadly, these tools will facilitate rapid fusion gene construction for subsequent functional characterization and translation into personalized treatment strategies. Cancer Res; 77(13); 3502-12. ©2017 AACR.


Figures

Figure 1
Figure 1. Multi-fragment recombineering of fusion genes
(A) Schematic illustration of fusion gene construction. ATG = translation start site; B1/P1, B2/P2, B2r/P2r, B4/P4 = recombination sites for BP recombination; L1/R1, L2/R2, L4/R4 = recombination sites for LR recombination; pFor and pRev = PCR detection primers. (B) Ba/F3 cell survival assay for BCR-ABL1, EML4-ALK, and ETV6-NTRK3 seven days following IL3 depletion (mean luminescence, error bars denote standard deviation, N=3). (C) Immunoblots of BCR-ABL1 and EML4-ALK expression in Ba/F3. Arrow denotes the correct size of BCR-ABL1. (D) PCR detection of the indicated fusion transcripts from Ba/F3 RNA/cDNA extracts. B = fusion DNA backbone (positive control); - = cDNA from GFP-expressing cells as negative control. (E) Dose-dependent survival assays of Ba/F3 cells expressing BCR-ABL1 and EML4-ALK treated with imatinib and crizotinib, respectively, for 72 hours (mean percentage of cell survival, error bars denote standard deviation, N=4). (F) Endpoint volumes (Day 59 post-injection) of xenograft tumors by HMLER cells expressing ETV6-NTRK3 (N=8) and GFP control (N=15). Horizontal bars denote mean volumes; error bars denote standard deviation. All p-values calculated by t-test; *, p<0.05; **, p<0.01; ****, p<0.0001.
Figure 2
Figure 2. Oncogenic validation of MET fusions
(A) Schematic illustration of MET fusion genes. (B) Ba/F3 cell survival assay for MET fusions (mean luminescence, error bars denote standard deviation, N=3) compared to positive control, BCR-ABL1, GFP = negative control. (C) MCF-10A anchorage-independent colony formation assays for all MET fusions (mean colony count from 10 random areas, error bars denote standard deviation, N=3). PIK3CAH1047R = positive control; GFP = negative control. (D) Dose-dependent survival assays of Ba/F3 cells expressing BAIAP2L1-MET and TFG-MET treated with crizotinib for 72 hours (mean percentage of cell survival, error bars denote standard deviation, N=4). (E) MCF-10A cells expressing BAIAP2L1-MET, CAPZA2-MET-2, wild-type MET, and parental were immunostained for MET (red) and Golgi body marker GM130 (green). DNA was labeled with DAPI. Scale bar: 50μM. All p-values calculated by t-test; ns, not significant; **, p<0.01; ****, p<0.0001.
Figure 3
Figure 3. Oncogenic validation of NTRK2 fusions
(A) Schematic illustration of NTRK2 fusion genes. (B) Ba/F3 cell survival assay for NTRK2 fusions (mean luminescence, error bars denote standard deviation, N=3) compared to positive control, ETV6-NTRK3, GFP = negative control. (C) MCF-10A anchorage-independent colony formation assays for NTRK2 fusions (mean colony count from 10 random areas, error bars denote standard deviation, N=3). GFP = negative control. (D) Dose-dependent survival assays of Ba/F3 cells expressing AFAP1-NTRK2 and SQSTM1-NTRK2 treated with entrectinib for 72 hours (mean percentage of cell survival, error bars denote standard deviation, N=4). All p-values calculated by t-test; ns, not significant; *, p<0.05; ****, p<0.0001.
Figure 4
Figure 4. Oncogenic validation and domain-function studies of BRAF fusion genes
(A) Schematic illustration of BRAF fusion genes. (B) Ba/F3 cell survival assay for BRAF fusions (mean luminescence, error bars denote standard deviation, N=3 respectively). ATG7-BRAF = positive control; GFP = negative control. (C) Immunoblots of BRAF fusions expression and MAPK signaling activation in Ba/F3. (D) Dose-dependent survival assays of Ba/F3 cells expressing FAM114A2-BRAF fusions treated with dabrafenib and trametinib for 72 hours (mean percentage of cell survival, error bars denote standard deviation, N=4 respectively). ATG7-BRAF = positive control. (E) Ba/F3 cell survival assay for the indicated full-length, wild-type genes (mean luminescence, error bars denote standard deviation, N=3 respectively) compared to BRAFV600E (positive control). GFP = negative control. (F) Ba/F3 cell survival assay for BRAF kinase domain (BRAF-ex9: Exons 9–18; BRAF-ex11: Exons 11–18) and corresponding GFP-BRAF-ex9/11 fusions with and without STOP codon following GFP (mean luminescence, error bars denote standard deviation, N=3) compared to full-length, wild-type BRAF. BRAFV600E = positive control; GFP = negative control. (G) Schematic illustration of construct structures and (H) activities in Ba/F3 cell survival assay: BRAF kinase domain (Exons 9–18) fused to i) full-length BRAF N-terminus = N-BRAF-ex9; ii) fragment corresponding to BRAF AA100-345 = N100-345-BRAF-ex9; iii) kinase domain only = BRAF-ex9; iv) GFP = GFP-BRAF-ex9. Shown mean luminescence, error bars denote standard deviation, N=3. All p-values calculated by t-test; **, p<0.01; ***, p<0.001; ****, p<0.0001.
Figure 5
Figure 5. BRAF fusion modularity and mutation studies
(A) Schematic illustration and (B) activities in Ba/F3 of BRAF kinase domain (Exons 9–18) fused to BRAF AA100-345 with or without F247L mutation (mean luminescence, error bars denote standard deviation, N=3 respectively). GFP-BRAF-ex9 and N-BRAF-ex9 (V600E) = positive control; N-BRAF-ex9 and GFP = negative control. (C) Immunoblots of BRAF structural constructs expression and MAPK signaling activation in Ba/F3. (D) Ba/F3 cell survival assay of full-length BRAFF247L; shown mean luminescence, error bars denote standard deviation, N=3; BRAFV600E = positive control; GFP = negative control. (E) Immunoblots of expression of full-length BRAFF247L, wild-type BRAF, and BRAFV600E in Ba/F3. (F) Dose-dependent survival assays of Ba/F3 cells expressing full-length BRAFF247L treated with dabrafenib and trametinib for 72 hours (mean percentage of cell survival, error bars denote standard deviation, N=4 respectively). All p-values calculated by t-test; **, p<0.01; ****, p<0.0001.

References

    1. Mitelman F, Johansson B, Mertens F. The impact of translocations and gene fusions on cancer causation. Nature reviews Cancer. 2007;7:233–45. - PubMed
    1. Kantarjian H, Shah NP, Hochhaus A, Cortes J, Shah S, Ayala M, et al. Dasatinib versus imatinib in newly diagnosed chronic-phase chronic myeloid leukemia. N Engl J Med. 2010;362:2260–70. - PubMed
    1. Druker BJ, Talpaz M, Resta DJ, Peng B, Buchdunger E, Ford JM, et al. Efficacy and safety of a specific inhibitor of the BCR-ABL tyrosine kinase in chronic myeloid leukemia. N Engl J Med. 2001;344:1031–7. - PubMed
    1. Shaw AT, Kim DW, Nakagawa K, Seto T, Crino L, Ahn MJ, et al. Crizotinib versus chemotherapy in advanced ALK-positive lung cancer. N Engl J Med. 2013;368:2385–94. - PubMed
    1. Shaw AT, Kim DW, Mehra R, Tan DS, Felip E, Chow LQ, et al. Ceritinib in ALK-rearranged non-small-cell lung cancer. N Engl J Med. 2014;370:1189–97. - PMC - PubMed

Publication types

Substances