. 2017 May 16;7(1):1971.
doi: 10.1038/s41598-017-02201-5.

The perceived stability of scenes: serial dependence in ensemble representations

Affiliations

The perceived stability of scenes: serial dependence in ensemble representations

Mauro Manassi et al. Sci Rep. .

Abstract

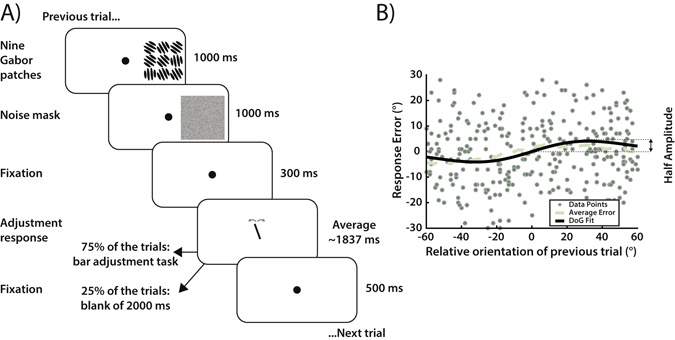
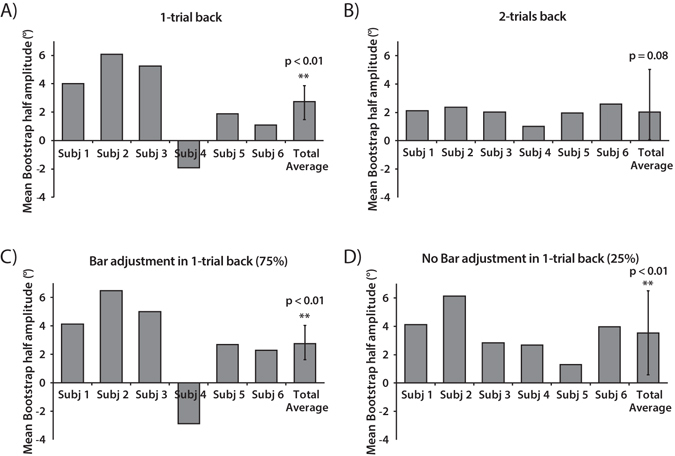
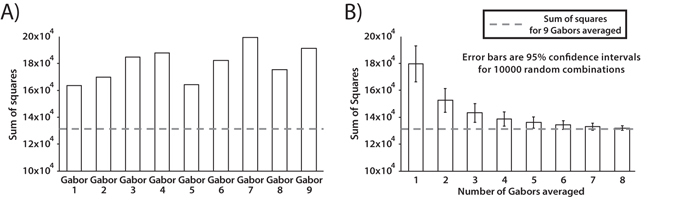
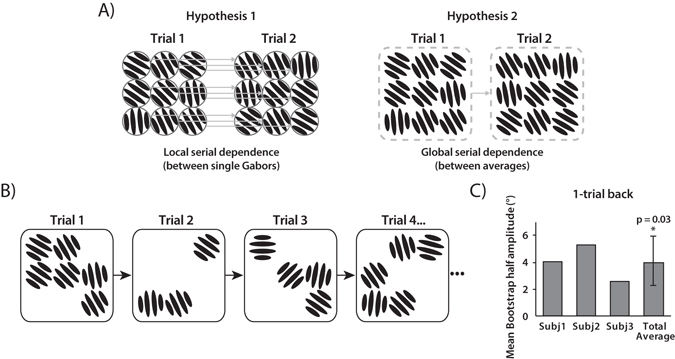
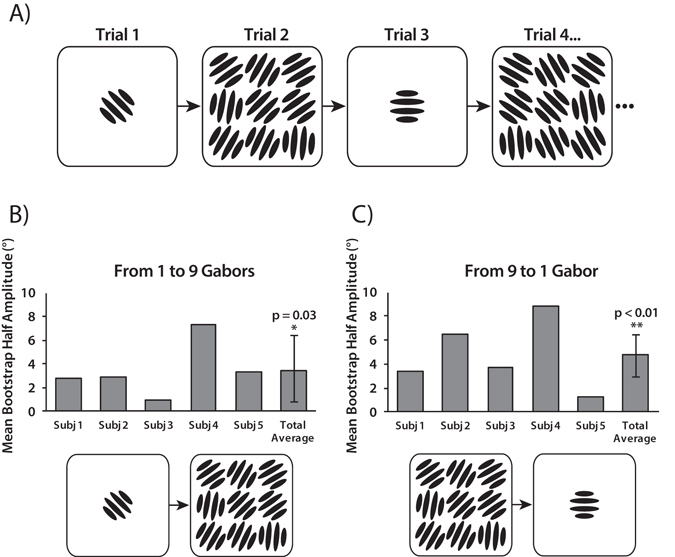
We are continuously surrounded by a noisy and ever-changing environment. Instead of analyzing all the elements in a scene, our visual system has the ability to compress an enormous amount of visual information into ensemble representations, such as perceiving a forest instead of every single tree. Still, it is unclear why such complex scenes appear to be the same from moment to moment despite fluctuations, noise, and discontinuities in retinal images. The general effects of change blindness are usually thought to stabilize scene perception, making us unaware of minor inconsistencies between scenes. Here, we propose an alternative, that stable scene perception is actively achieved by the visual system through global serial dependencies: the appearance of scene gist is sequentially dependent on the gist perceived in previous moments. To test this hypothesis, we used summary statistical information as a proxy for "gist" level, global information in a scene. We found evidence for serial dependence in summary statistical representations. Furthermore, we show that this kind of serial dependence occurs at the ensemble level, where local elements are already merged into global representations. Taken together, our results provide a mechanism through which serial dependence can promote the apparent consistency of scenes over time.


Conflict of interest statement

The authors declare that they have no competing interests.

Figures

Figure 1
Figure 1
Experiment 1, trial sequence and data analysis. (A) Trial sequence for the method of adjustment task in Experiment 1. On each trial, a 3 × 3 grid of nine Gabors was presented for 1000 ms, followed by a 1000 ms noise mask of black and white pixels (to reduce afterimages) and a 300 ms fixation dot. Subjects were then asked to report the perceived average orientation of the Gabor array by adjusting the orientation of a response bar (75% of the trials) or to keep fixating the dot for an additional 2000 ms (25% of the trials). After a 500 ms delay, the next trial started. (B) Example data from Subject 2, with each data point showing performance on one trial. The x-axis represents the difference between the previous mean orientation and the current mean orientation. The y-axis represents the error in the adjustment task (difference between bar orientation and mean orientation on current trial). The average error (dashed line) shows more negative response errors for a negative relative orientation and more positive errors for a positive relative orientation. In order to quantify the magnitude of serial dependence, we fit a derivative-of-Gaussian (DoG) to the data (black line) measuring the half-amplitude peak for each observer.
Figure 2
Figure 2
Mean bootstrapped half-amplitudes in Experiment 1. For each observer we obtained a mean bootstrapped half-amplitude by resampling the data with replacement 5000 times. Error bars on the Total Average are bootstrapped 95% confidence intervals, and the p value is based on the group null distribution. (A) Serial dependence half-amplitudes 1-trial back. (B) Serial dependence half-amplitudes 2-trials back. (C) Serial dependence half-amplitudes with bar adjustment 1-trial back. (D) Serial dependence half-amplitudes without bar adjustment 1-trial back.
Figure 3
Figure 3
Sum of the squares analysis for Subject 2 in Experiment 1. Dashed lines indicate sum of the squares of the derivative-of-Gaussian fit for the average of nine Gabors (the empirically measured SSE for a plot like that in Fig. 1B). White bars indicate sum of the squares of the derivative-of-Gaussian fit for (A) single Gabors or (B) averages of subsets of Gabors. (A) The sum of the squares for the mean orientation is lower than any single Gabor, meaning that the observers did not match the bar orientation using a single Gabor. (B) The empirically measured sum of the squares for the mean is similar to the sum of the squares expected from a sample of five or more Gabor patches that have been averaged. This indicates that subjects averaged at least five Gabors. The mean of nine Gabors predicted responses significantly better than 5 or fewer Gabor patches for one subject, 4 or fewer for three subjects and 3 or fewer for two subjects.
Figure 4
Figure 4
Experiment 2 stimuli and results. (A) Serial dependence may occur between single Gabors, following a retinotopic local correspondence (Hypothesis 1), or between orientation averages independent of retinotopic correspondence (Hypothesis 2). (B) From trial to trial, the Gabors were always presented in different numbers (from three to six) and spatial locations. (C) Mean bootstrapped half-amplitudes in Experiment 2 (1-trial back). Error bars are bootstrapped 95% confidence intervals, and the p-value is based on group null distribution.
Figure 5
Figure 5
Experiment 3 stimuli and results. (A) A single Gabor alternated with an array of Gabors from trial to trial. When a single Gabor was presented, observers were asked to adjust the bar to match the single Gabor’s orientation. When nine Gabors were presented, observers were asked to adjust the bar to match the ensemble (average) orientation. (BC) Mean bootstrapped half-amplitudes in Experiment 3 for serial dependence from a single Gabor orientation to an ensemble percept (B) and vice versa (C). Error bars are bootstrapped 95% confidence intervals, and p-value is based on group null distribution.

References

    1. Whitney, D., Haberman, J. & Sweeny, T. From Textures to Crowds: Multiple Levels of Summary Statistical Perception. The New Visual Neuroscience 695–710 (2014).
    1. Alvarez GA. Representing multiple objects as an ensemble enhances visual cognition. Trends Cogn. Sci. 2011;15:122–131. doi: 10.1016/j.tics.2011.01.003. - DOI - PubMed
    1. Dakin, S. C. Seeing Statistical Regularities: Texture and Pattern Perception. Oxford Handb. Percept. Organ. 150–167 (2015).
    1. Manassi M, Sayim B, Herzog MH. Grouping, pooling, and when bigger is better in visual crowding. J. Vis. 2012;12:1–14. doi: 10.1167/12.10.13. - DOI - PubMed
    1. Herzog MH, Manassi M. Uncorking the bottleneck of crowding: a fresh look at object recognition. Curr. Opin. Behav. Sci. 2015;1:86–93. doi: 10.1016/j.cobeha.2014.10.006. - DOI

Publication types

LinkOut - more resources