. 2017 May 2:10:124.
doi: 10.3389/fnmol.2017.00124. eCollection 2017.

Protein S Negatively Regulates Neural Stem Cell Self-Renewal through Bmi-1 Signaling

Affiliations

Protein S Negatively Regulates Neural Stem Cell Self-Renewal through Bmi-1 Signaling

Katya Zelentsova-Levytskyi et al. Front Mol Neurosci. .

Abstract

Revealing the molecular mechanisms underlying neural stem cell self-renewal is a major goal toward understanding adult brain homeostasis. The self-renewing potential of neural stem and progenitor cells (NSPCs) must be tightly regulated to maintain brain homeostasis. We recently reported the expression of Protein S (PROS1) in adult hippocampal NSPCs, and revealed its role in regulation of NSPC quiescence and neuronal differentiation. Here, we investigate the effect of PROS1 on NSPC self-renewal and show that genetic ablation of Pros1 in neural progenitors increased NSPC self-renewal by 50%. Mechanistically, we identified the upregulation of the polycomb complex protein Bmi-1 and repression of its downstream effectors p16Ink4a and p19Arf to promote NSPC self-renewal in Pros1-ablated cells. Rescuing Pros1 expression restores normal levels of Bmi-1 signaling, and reverts the proliferation and enhanced self-renewal phenotypes observed in Pros1-deleted cells. Our study identifies PROS1 as a novel negative regulator of NSPC self-renewal. We conclude PROS1 is instructive for NSPC differentiation by negatively regulating Bmi-1 signaling in adult and embryonic neural stem cells.

Keywords: Bmi-1; PROS1; Protein S; neural stem cells; neurogenesis; self-renewal.


Figures

Figure 1
Figure 1
Deletion of Pros1 in neural cells leads to superfluous hippocampal neural stem cells. (A,B) Confocal images of adult hippocampus showing BrdU-positive cells (red) in Pros1fl/fl (control, A) and Pros1-cKO (B) adult mice. The dentate gyrus is delineated by NeuN immune-reactivity (blue). Mice were injected with BrdU for three consecutive days and analyzed 24 h after the last BrdU injection. (C–E) Increased Sox2+ cells in the SGZ of Pros1-cKO mice. Confocal images of Sox2-labeled cells (red) in control (C) and Pros1-cKO (D) adult SGZ. Nuclei are stained with Hoechst (blue). Arrows point to the SGZ. (E) Quantification of sox2+ cells in the SGZ). Bars represent the mean values ± SEM from six mice per genotype. ***P < 0.0001. Scale bar: (A–D) = 100 μm. (F–H) Representative confocal images of Nestin-GFP cells (green) and BrdU immunoreactivity (red) in control (F,F) and Pros1-cHet (G,G) adult SGZ. (F,G) are close up views of the boxed areas in (F,G), respectively. (H) Quiescent (radial) NSCs are easily detected as nestin-GFP+ cells spanning the granule cell with elaborate dendritic arbors extending into the molecular layer (asterisks). Scale bar: (F,G) = 100 μm; (H) = 20 μM. (I) Western blot analysis of hippocampal cell extracts from the indicated mice. Blots were reacted for PROS1 (top), GFP (center), and GAPDH (bottom) as a loading control. A blot representative of four independent experiments is shown. (J) Morphology-based quantification of the radial glia-like quiescent NSCs dendritic arbors from mice with the indicated genotypes. Dendritic arbors were defined as GFP+ ramifications extending from the granular layer into the molecular layer (asterisks in L). Mean values and standard errors were derived from five individual mice per genetic group. *P = 0.04. (K,L) Quantification of nestin-GFP-positive cells by FACS, representing the total NSC population (K; *P = 0.04) and of nestin-GFP+;GFAP cells representing the horizontal NSC sub-population (L; *P = 0.017). Mean values and standard errors were derived from five individual mice per genetic group.
Figure 2
Figure 2
Increased cell numbers expressing neural stem cell markers in neurospheres derived from Pros1-cKO NSCs. (A,B) Representative confocal images of Sox2 immunoreactivity in neurospheres generated from E14.5 control (A) and Pros1-cKO (B) NSCs. Scale bar: 50 μm. (C) Western blot analysis of Sox2 expression in culture-grown neurospheres. Whole cell extracts were isolated from spheres and subject to analysis. Actin reactivity serves as a loading control. Band intensities were quantified using NIH image J software. A blot representative of at least three different experiments is shown. Quantification of graphs represent mean values and standard errors from at least three independent experiments. **P = 0.008. (D–G) Quantification of cells expressing the neural stem cell protein markers Sox2 (D; P = 0.00066), Nestin (E; P = 0.01), vimentin (F; P = 0.01), and RT-qPCR relative expression levels of nanog (G; P = 0.01) in control and Pros1-cKO neurospheres generated from E14.5 embryos. Mean values and standard errors were derived from five individual experiments. A minimum of three and up to five embryos per genotype were pooled in each experiment. (H–J) Quantification of cells expressing the neural stem cell protein markers Sox2 (H; P = 0.0012), Nestin (I; P = 0.0038), vimentin (J; P = 0.0016) in control and Pros1-cKO neurospheres generated from adult SGZ NSCs. Pooled cells from 3 to 4 mice per genetic group were used for each experiment. Mean values and standard errors were derived from four individual experiments. ***P ≤ 0.001; **P ≤ 0.05.
Figure 3
Figure 3
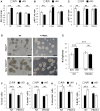
Increased self-renewal following Pros1-deletion. (A–D) Representative phase-contrast images of neurospheres generated from control (A) and Pros1-cKO (B) E14.5 NSCs and grown in culture for 4 days. Scale bar = 20 μM. (C–D) Quantification of primary (C) and secondary (D) neurospheres with diameter smaller or larger than 35 microns (hashed bars and solid bars, respectively) from control and Pros1-cKO NSCs. Mean values and standard errors were derived from 4 individual experiments. A minimum of three and up to five embryos per genotype were pooled in each experiment. ***P < 0.0001. Statistics are derived from measuring at least 100 neurospheres per experiment. (E–H) Representative phase-contrast images of secondary neurospheres generated from control (E) and Pros1-cKO (F) adult SGZ NSCs and grown in culture for 14 days. Scale bar = 50 μM. (G–H) Quantification of secondary (G) and tertiary (H) neurospheres with diameter smaller or larger than 35 microns (hashed bars and solid bars, respectively) from control and Pros1-cKO adult SGZ NSCs. Pooled cells from 3 to 4 mice per genetic group were used for each experiment. Mean values and standard errors were derived from four individual experiments. ***P < 0.0001. Statistics are derived from measuring at least 50 neurospheres per experiment. (I–L) Self-renewal assays from control and Pros1-cKO NSCs isolated from E14.5 cortices (I–K) and adult SGZ (L). (I) Representative images depicting self-renewal capacity of primary (top panels) and secondary (lower panels) neurospheres. Scale bar: 200 μm. Quantification of the number of primary (J; P = 0.002) and secondary (K; P = 0.02) neurospheres generated from 2,500 cells, after 10 days in culture. Mean values and standard errors were derived from four individual experiments. A minimum of three and up to five embryos per genotype were pooled in each experiment. (L) Quantification of the number of secondary neurospheres generated from 2,500 adult-SGZ hippocampal NSCs, after 10 days in culture. P = 0.0006. Pooled cells from 3 to 4 mice per genotype were used for each experiment. Mean values and standard errors were derived from four individual experiments. At least 60 E14.5 and 30 adult-derived neurospheres were counted per experiment. ***P < 0.001; **P < 0.01; *P < 0.05.
Figure 4
Figure 4
Pros1 suppresses NSC self-renewal through Bmi-1 inhibition. (A,B) RT-qPCR relative expression levels of Bmi-1, and the Bmi-1 downstream genes p16Ink4a and p19Arf in neurospheres derived from E14.5 (A) and adult SGZ (B) NSPCs from control (white bars) and cKO (black bars) cells. Mean values ± SEM were derived from 4 individual experiments. A minimum of three and up to five embryos per genotype or 3–4 adult mice were pooled in each experiment. (C–F) Rescuing Pros1 expression in cKO NSPCs restores Bmi-1 signaling. (C) Pros1 expression was determined by qRT-PCR from neurospheres derived from Pros1-cKO NSPCs from non-treated control (NT, white bar), GFP-electroporated control (gray bar), and Pros1-electroporated (black bar) NSPCs. ***P < 0.001; NS, no statistical significance. All cells were allowed to grow for 3 days following electroporation. Graphs represent mean values ± from four individual experiments, with at least two embryos from each genotype pooled in each experiment. (D–F) Rescuing Pros1 expression downregulates Bmi-1 levels (D; P = 0.03), along with upregulation of p16Ink4a (E; P = 0.013) and p19Arf (F; P = 0.001) in cKO NSPCs treated with a Pros1-expressing vector (black bars). Non-treated NSCs (NT, white bar), or cells electroporated with a GFP control vector (gray bar) were not affected. NS, no statistical significance. Graphs represent mean values ± from four individual experiments. At least two embryos from each genotype pooled in each experiment. (G,H) Phenotypic rescue following PROS1 rescue in cKO NSPCs. Phase contrast (G,H) quantification of self-renewal rates performed on non-treated (NT, white bar), control-electroporated (GFP, gray bar) or Pros1-electroporated (Pros1, black bar) cells. ***P < 0.0001; NS, no statistical significance. At least 60 neurospheres per genotype were scored for statistical evaluation. Graphs represent mean values ± from four individual experiments. ***P < 0.001; **P < 0.01; *P < 0.05.
Figure 5
Figure 5
Knockdown of Bmi-1 in Pros1-cKO NSCs restores Bmi-1 signaling and self-renewal. RT-qPCR relative expression levels of Bmi-1 (A) p16Ink4a (B) and p19Arf (C) in neurospheres derived from Pros1-cKO NSPCs following Bmi-1 knockdown. ***P < 0.001; NS, no statistical significance. Non-treated NSPCs (NT, white bar), or cells electroporated with a control sh vector (sh-irr, gray bar) were not affected. Cells electroporated with sh-Bmi-1 are presented by the black bars. Graphs represent mean values ± from four individual experiments. At least two embryos from each genotype were pooled in each experiment. (D–I) Bmi-1 knockdown in cKO NSPCs suppresses their increased proliferation and self-renewal. Proliferation (D) was measured by BrdU incorporation (10 μM added to the culture medium 4 h prior to fixation), and self-renewal (E,F) was measured by the number of neurospheres generated from 2,500 NSPCs. Neurospheres were documented by phase-contrast microscopy (E) and quantified (F). ***P < 0.001. At least 60 neurospheres per genotype were scored for statistical evaluation. Graphs represent mean values ± from four individual experiments. At least two embryos from each genotype were pooled in each experiment. (G–I) Phenotypic rescue of NSCs markers following shBmi-1 in cKO NSPCs. Scoring the percent of nestin+ (G), Sox2+ (H), and vimentin+ (I) cells in non-treated, sh-irr and shBmi-1 treated cells. ***P < 0.001; **P < 0.01. Graphs represent mean values ± from four independent experiments. At least two embryos from each genotype were pooled in each experiment.
Figure 6
Figure 6
Both Bmi-1 pathway genes and self-renewal are rescued following addition of exogenous PROS1. (A–C) Purified PROS1 rescues Bmi-1 pathway gene expression. RT-qPCR relative expression levels of Bmi-1 (A) p16Ink4a (B) and p19Arf (C) in neurospheres derived from Pros1-cKO NSPCs that were grown either in their own conditioned medium (NT), following exchange of CM from control cells (C-CM), or grown in medium supplemented with purified PROS1 (35 nmol/Lit). **P < 0.01; NS, no statistical significance. Mean values ± SEM were derived from 4 independent experiments. Statistics are derived from measuring at least 100 neurospheres in each experiment. (D–I) Neural stem cell self-renewal in Pros1-cKO NSPCs is rescued by purified PROS1. Phase contrast (D) and quantification (E) of self-renewal following addition or not of purified PROS1 (35 nmol/Lit) from NSPCs derived from control (fl/fl, white bars) or Pros1-cKO mice (cKO, black bars). ***P < 0.001; NS, no statistical significance. Mean values ± SEM were derived from four independent experiments. Statistics are derived from measuring at least 200 neurospheres per condition in each experiment. Scale bars: 50 μM. Decreased self-renewal by exogenous PROS1 is also evident by the numbers of cells positive for the NSC markers Sox2 (F), nestin (G), vimentin (H), and by decreased proliferation as measured by BrdU incorporation (I). ***P < 0.001; **P < 0.01; *P < 0.05; NS, no statistical significance. Mean values ± SEM were derived from four independent experiments.

References

    1. Ables J. L., Decarolis N. A., Johnson M. A., Rivera P. D., Gao Z., Cooper D. C., et al. . (2010). Notch1 is required for maintenance of the reservoir of adult hippocampal stem cells. J. Neurosci. 30, 10484–10492. 10.1523/JNEUROSCI.4721-09.2010 - DOI - PMC - PubMed
    1. Bonaguidi M. A., Wheeler M. A., Shapiro J. S., Stadel R. P., Sun G. J., Ming G. L., et al. . (2011). In vivo clonal analysis reveals self-renewing and multipotent adult neural stem cell characteristics. Cell 145, 1142–1155. 10.1016/j.cell.2011.05.024 - DOI - PMC - PubMed
    1. Breunig J. J., Silbereis J., Vaccarino F. M., Sestan N., Rakic P. (2007). Notch regulates cell fate and dendrite morphology of newborn neurons in the postnatal dentate gyrus. Proc. Natl. Acad. Sci. U.S.A. 104, 20558–20563. 10.1073/pnas.0710156104 - DOI - PMC - PubMed
    1. Burstyn-Cohen T., Heeb M. J., Lemke G. (2009). Lack of Protein S in mice causes embryonic lethal coagulopathy and vascular dysgenesis. J. Clin. Invest. 119, 2942–2953. 10.1172/JCI39325 - DOI - PMC - PubMed
    1. Burstyn-Cohen T., Lew E. D., Traves P. G., Burrola P. G., Hash J. C., Lemke G. (2012). Genetic dissection of TAM receptor-ligand interaction in retinal pigment epithelial cell phagocytosis. Neuron 76, 1123–1132. 10.1016/j.neuron.2012.10.015 - DOI - PMC - PubMed

LinkOut - more resources