. 2017 May 2:8:738.
doi: 10.3389/fmicb.2017.00738. eCollection 2017.

Colonization and Succession within the Human Gut Microbiome by Archaea, Bacteria, and Microeukaryotes during the First Year of Life

Affiliations

Colonization and Succession within the Human Gut Microbiome by Archaea, Bacteria, and Microeukaryotes during the First Year of Life

Linda Wampach et al. Front Microbiol. .

Abstract

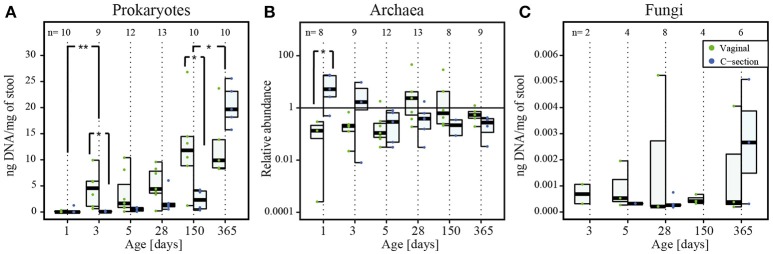
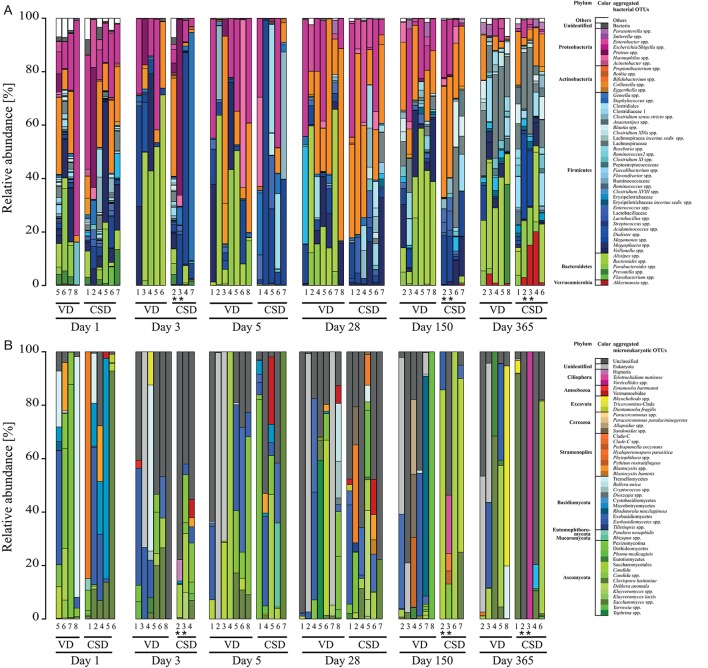
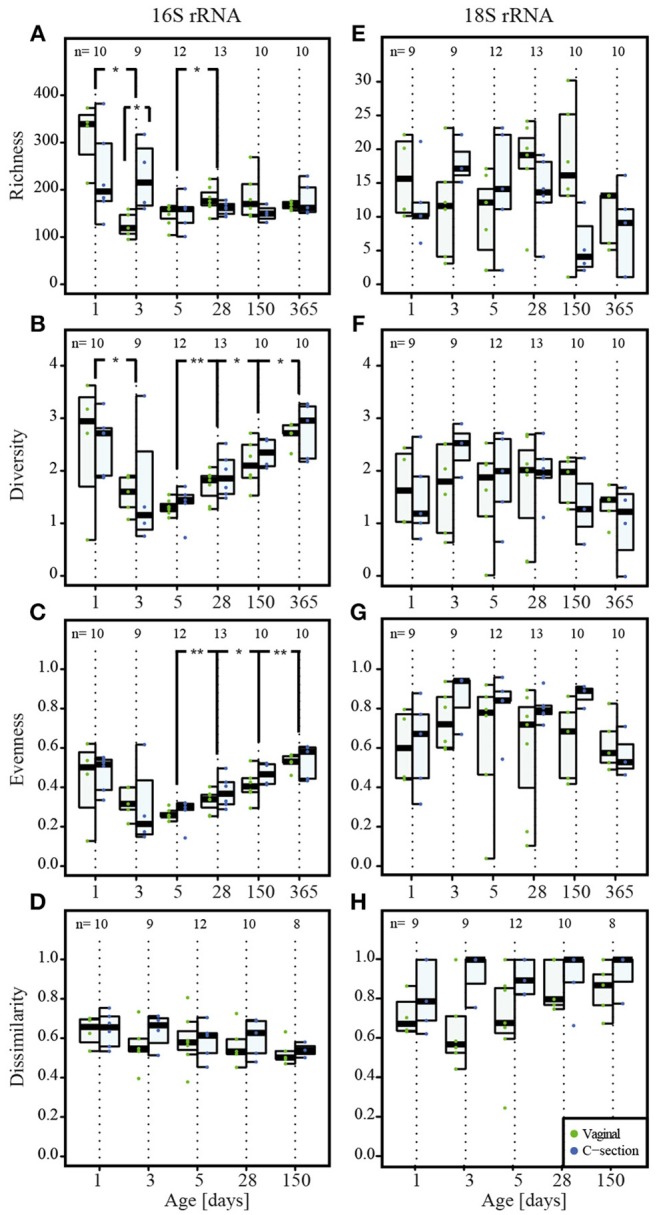
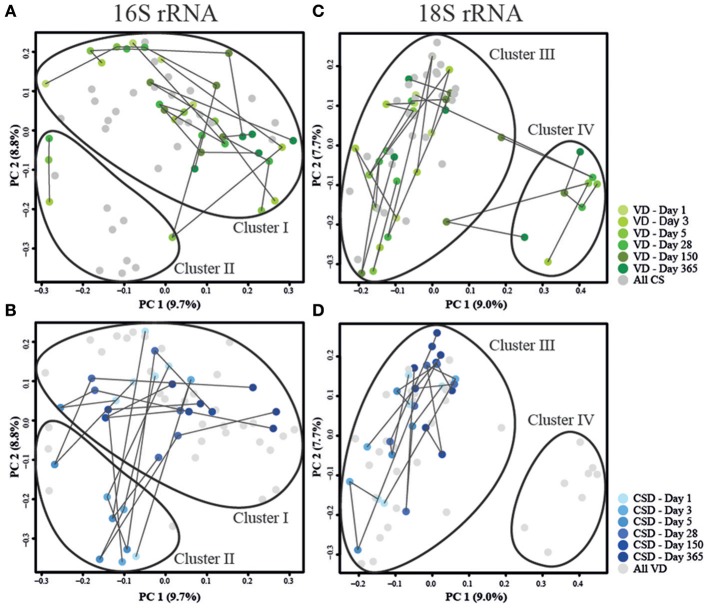
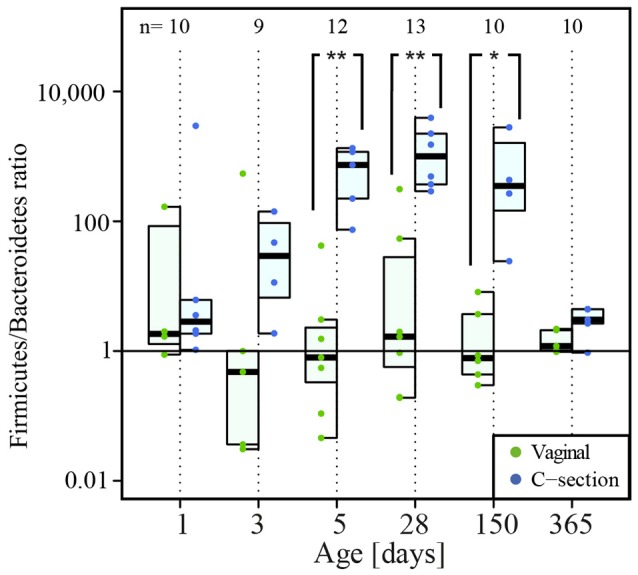
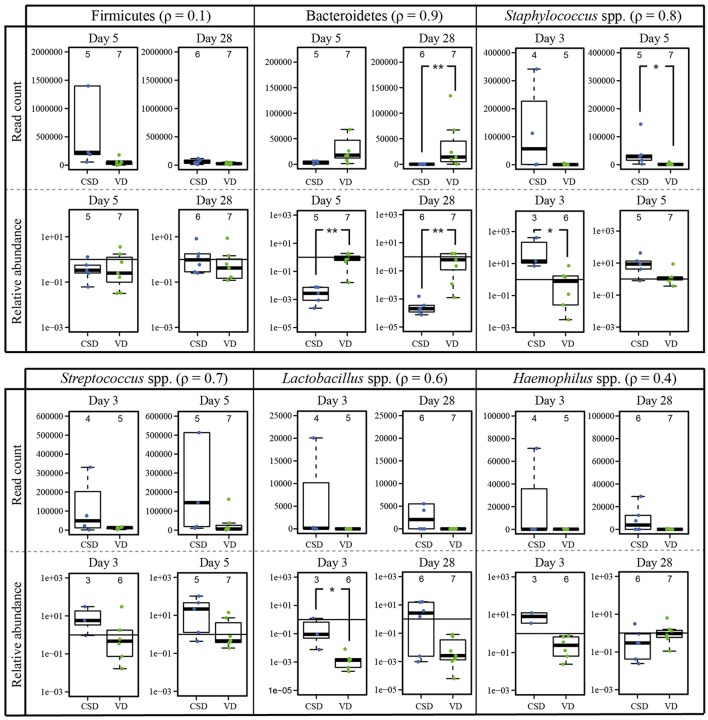
Perturbations to the colonization process of the human gastrointestinal tract have been suggested to result in adverse health effects later in life. Although much research has been performed on bacterial colonization and succession, much less is known about the other two domains of life, archaea, and eukaryotes. Here we describe colonization and succession by bacteria, archaea and microeukaryotes during the first year of life (samples collected around days 1, 3, 5, 28, 150, and 365) within the gastrointestinal tract of infants delivered either vaginally or by cesarean section and using a combination of quantitative real-time PCR as well as 16S and 18S rRNA gene amplicon sequencing. Sequences from organisms belonging to all three domains of life were detectable in all of the collected meconium samples. The microeukaryotic community composition fluctuated strongly over time and early diversification was delayed in infants receiving formula milk. Cesarean section-delivered (CSD) infants experienced a delay in colonization and succession, which was observed for all three domains of life. Shifts in prokaryotic succession in CSD infants compared to vaginally delivered (VD) infants were apparent as early as days 3 and 5, which were characterized by increased relative abundances of the genera Streptococcus and Staphylococcus, and a decrease in relative abundance for the genera Bifidobacterium and Bacteroides. Generally, a depletion in Bacteroidetes was detected as early as day 5 postpartum in CSD infants, causing a significantly increased Firmicutes/Bacteroidetes ratio between days 5 and 150 when compared to VD infants. Although the delivery mode appeared to have the strongest influence on differences between the infants, other factors such as a younger gestational age or maternal antibiotics intake likely contributed to the observed patterns as well. Our findings complement previous observations of a delay in colonization and succession of CSD infants, which affects not only bacteria but also archaea and microeukaryotes. This further highlights the need for resolving bacterial, archaeal, and microeukaryotic dynamics in future longitudinal studies of microbial colonization and succession within the neonatal gastrointestinal tract.

Keywords: amplicon sequencing; delivery mode; fungi; infant gut microbiome; microbial colonization; quantitative real-time PCR; succession.


Figures

Figure 1
Figure 1
Detection of prokaryotes, archaea and fungi in infant stool during the first year of life. (A) Absolute quantification of 16S rRNA gene copy numbers for prokaryotic DNA (ng DNA per mg of stool), (B) relative quantification of archaeal read counts. (C) Absolute quantification of 18S rRNA gene copy numbers for fungal DNA (ng DNA per mg of stool) by quantitative real-time PCR and over the course of the first year of life. The numbers of samples per collection time point are provided at the top of the graph. For the purpose of clarity, only significant differences between subsequent time points are shown in the figure; for all significant differences between collection time points, see Supplementary File 1, Tables S3, S4. Significant differences obtained by Wilcoxon rank sum test between consecutive time points are represented by asterisks (* when P < 0.05; ** when P < 0.01). CSD, C-section delivery; VD, vaginal delivery. Fecal samples originating from VD infants are represented on the left side of each barplot and by green points, samples from CSD infants are represented on the right side of each barplot and by blue points.
Figure 2
Figure 2
Prokaryotic and microeukaryotic microbiome compositions in infants over the first year of life. Barplots of relative abundances of the 49 most abundant taxa per sample for (A) prokaryotes and (B) microeukaryotes for both delivery modes. All OTUs with the same taxonomy were regroupedd into the same taxa, whereas taxa that did not belong to the 49 most abundant were regrouped under “Others.” Sequences were classified to the highest taxonomic level that could be confidently assigned. Aggregated OTUs are color-coded according to the phylum they belong to. Numbers below the barplots are representative of the different infants in the study. CSD, C-section delivery; VD, vaginal delivery. *Twins.
Figure 3
Figure 3
Colonization of prokaryotes and microeukaryotes. Depiction of (A,E) richness (number of OTUs), (B,F) diversity (Shannon's diversity index), (C,G) evenness (Pielou's evenness index) and (D,H) dissimilarity index reflecting the distance to the most mature sample (Soerensen's similarity index of presence/absence of taxa at each individual time point compared to the most mature microbial community structures represented by samples collected at the last individual time point) for prokaryotes and microeukaryotes, respectively. Dominant phylotypes for prokaryotic and microeukaryotic datasets were considered. The numbers of samples per collection time point are provided at the top of the graph. For the purpose of clarity, only significant differences as assessed by Wilcoxon rank sum test between subsequent time points are shown in the figure; for all significant differences between collection time points, see Supplementary File 1, Table S3 for the prokaryotic and Table S4 for the microeukaryotic datasets. Significant differences between consecutive time points are represented by asterisks (* when P < 0.05; ** when P < 0.01). CSD, C-section delivery; VD, vaginal delivery. Fecal samples originating from VD infants are represented on the left side of each barplot and by green points, samples from CSD infants are represented on the right side of each barplot and by blue points.
Figure 4
Figure 4
Principal coordinate analyses of Jensen–Shannon distances for prokaryotic and microeukaryotic rRNA gene amplicon sequencing data. Depiction of (A,C) data from VD infants in green and (B,D) CSD infants in blue for prokaryotes and microeukaryotes, respectively. Sampling time points are represented by shadings, with lighter colors depicting an earlier sampling time point. Lines connect samples which originated from the same infant according the order of sampling. Samples that are the focus of the corresponding other sub-panel are shaded in gray. Cluster delineations were added manually after computing the cluster membership of each sample using the partitioning around medoids (pam) function contained in the R package “cluster” (Maechler et al., 2016).
Figure 5
Figure 5
Firmicutes/Bacteroidetes ratio over time. The numbers of samples per collection time point are given at the top of the graph. Significant differences obtained by Wilcoxon rank sum test and according to delivery mode are represented by asterisks (*when P < 0.05; ** when P < 0.01). CSD, C-section delivery; VD, vaginal delivery. Fecal samples originating from VD infants are represented on the left side of each barplot and by green points, samples from CSD infants are represented on the right side of each barplot and by blue points.
Figure 6
Figure 6
Colonization by Bacteroidetes phylum. Per collection time point depiction of (A) richness (number of OTUs), (B) diversity (Shannon's diversity index), and (C) evenness (Pielou's evenness index) of the phylum Bacteroidetes. The numbers of samples per collection time point are provided at the top of the graph. Significant differences as assessed by Wilcoxon rank sum test and according to delivery mode are represented by asterisks (* when P < 0.05; ** when P < 0.01). CSD, C-section delivery; VD, vaginal delivery. Fecal samples originating from VD infants are represented on the left side of each barplot and by green points, samples from CSD infants are represented on the right side of each barplot and by blue points.
Figure 7
Figure 7
qPCR validation of 16S rRNA gene sequencing data based differences according to delivery mode. Comparison of the DESeq2-normalized 16S rRNA read numbers and relative abundances (given on log scale) measured by qPCR for two phyla and four genera that were found to be significantly different between birth modes. For each comparison the Spearman correlation coefficient (ρ) was calculated and figures next to the taxa. The numbers of samples per collection time point are given at the top of each barplot. Significant differences according to a Wilcoxon rank sum test for delivery mode are represented by asterisks (* when P < 0.05; ** when P < 0.01). CSD, C-section delivery; VD, vaginal delivery. Fecal samples originating from CSD infants are represented on the left side of each barplot and by blue points, samples from VD infants are on the right side of each barplot and by green points.

References

    1. Abrahamsson T. R., Jakobsson H. E., Andersson A. F., Björkstén B., Engstrand L., Jenmalm M. C. (2012). Low diversity of the gut microbiota in infants with atopic eczema. J. Allergy Clin. Immunol. 129, 434–440, 440.e1-2. 10.1016/j.jaci.2011.10.025 - DOI - PubMed
    1. Abrahamsson T. R., Jakobsson H. E., Andersson A. F., Björkstén B., Engstrand L., Jenmalm M. C. (2014). Low gut microbiota diversity in early infancy precedes asthma at school age. Clin. Exp. Allergy 44, 842–850. 10.1111/cea.12253 - DOI - PubMed
    1. Adlerberth I., Lindberg E., Åberg N., Hesselmar B., Saalman R., Strannegård I.-L., et al. (2006). Reduced enterobacterial and increased staphylococcal colonization of the infantile bowel: an effect of hygienic lifestyle? Pediatr. Res. 59, 96–101. 10.1203/01.pdr.0000191137.12774.b2 - DOI - PubMed
    1. Al-Kubaisy W., Al-Rubaey M., Al-Naggar R. A., Karim B., Mohd Noor N. A. (2014). Maternal obesity and its relation with the cesarean section: a hospital based cross sectional study in Iraq. BMC Pregnancy Childbirth 14:235. 10.1186/1471-2393-14-235 - DOI - PMC - PubMed
    1. Andersen L. O., Nielsen H. V., Stensvold C. R. (2013). Waiting for the human intestinal Eukaryotome. ISME J. 7, 1253–1255. 10.1038/ismej.2013.21 - DOI - PMC - PubMed