. 2017 May 2:8:630.
doi: 10.3389/fpls.2017.00630. eCollection 2017.

Transcriptional Responses to Pre-flowering Leaf Defoliation in Grapevine Berry from Different Growing Sites, Years, and Genotypes

Affiliations

Transcriptional Responses to Pre-flowering Leaf Defoliation in Grapevine Berry from Different Growing Sites, Years, and Genotypes

Sara Zenoni et al. Front Plant Sci. .

Abstract

Leaf removal is a grapevine canopy management technique widely used to modify the source-sink balance and/or microclimate around berry clusters to optimize fruit composition. In general, the removal of basal leaves before flowering reduces fruit set, hence achieving looser clusters, and improves grape composition since yield is generally curtailed more than proportionally to leaf area itself. Albeit responses to this practice seem quite consistent, overall vine performance is affected by genotype, environmental conditions, and severity of treatment. The physiological responses of grape varieties to defoliation practices have been widely investigated, and just recently a whole genome transcriptomic approach was exploited showing an extensive transcriptome rearrangement in berries defoliated before flowering. Nevertheless, the extent to which these transcriptomic reactions could be manifested by different genotypes and growing environments is entirely unexplored. To highlight general responses to defoliation vs. different locations, we analyzed the transcriptome of cv. Sangiovese berries sampled at four development stages from pre-flowering defoliated vines in two different geographical areas of Italy. We obtained and validated five markers of the early defoliation treatment in Sangiovese, an ATP-binding cassette transporter, an auxin response factor, a cinnamyl alcohol dehydrogenase, a flavonoid 3-O-glucosyltransferase and an indole-3-acetate beta-glucosyltransferase. Candidate molecular markers were also obtained in another three grapevine genotypes (Nero d'Avola, Ortrugo, and Ciliegiolo), subjected to the same level of selective pre-flowering defoliation (PFD) over two consecutive years in their different areas of cultivation. The flavonol synthase was identified as a marker in the pre-veraison phase, the jasmonate methyltransferase during the transition phase and the abscisic acid receptor PYL4 in the ripening phase. The characterization of transcriptome changes in Sangiovese berry after PFD highlights, on one hand, the stronger effect of environment than treatment on the whole berry transcriptome rearrangement during development and, on the other, expands existing knowledge of the main molecular and biochemical modifications occurring in defoliated vines. Moreover, the identification of candidate genes associated with PFD in different genotypes and environments provides new insights into the applicability and repeatability of this crop practice, as well as its possible agricultural and qualitative outcomes across genetic and environmental variability.

Keywords: berry transcriptome; flavonoid; grapevine; pre-flowering defoliation; secondary metabolite.


Figures

FIGURE 1
FIGURE 1
Whole transcriptome analysis of Sangiovese berries subjected to PFD treatment in two different sites. (A) Schematic representation of the sampling design used. (B) Cluster dendrogram of the whole transcriptome dataset in all analyzed samples. Pearson’s correlation values were converted into distance coefficients to define the height of the dendrogram. Samples are colored according to the developmental stage of sampling. (C) Score scatterplot (PC1 vs. PC2) of the PCA model (9 Principal Components, R2(cumulative) = 0.903, Q2(cumulative) = 0.848) applied to the significantly modulated transcripts dataset. Samples are colored according to the developmental stage of sampling. Different treatments are indicated by different symbols, “ding73” = Control and “formula image” = Pre-flowering defoliation.
FIGURE 2
FIGURE 2
Transcriptomic responses to PFD treatment in two different sites. (A) Differentially expressed genes (t-test with a α = 0.01) between C and PFD vines at each sampling time point in the two sites. (B) Venn diagram summarizing results obtained in (A) was constructed using Venny 2.1.0 and redrawn. (C) Gene Ontology (GO) enrichment analysis was performed, using the AgriGO online software (Du et al., 2010), on Bologna-, Ancona-, and common PFD modulated transcripts separately. Statistically significant GO categories are highlighted in color, according to the given significance color-key.
FIGURE 3
FIGURE 3
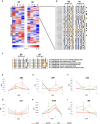
PFD treatment molecular markers of Sangiovese cultivar selection and real-time qPCR validation in 2012. (A) Heat map representing the fluorescence intensity of C vines in the 125 commonly modulated genes. KMC analysis was used to determine the transcripts with unaltered expression between Bologna and Ancona sites (highlighted as same cluster) and those with different expression (highlighted as different cluster). (B) Schematic representation of the Fold Change (FC), calculated between C and PFD vines at each developmental stage in Ancona and Bologna, in the 38 same cluster transcripts found in (A). The black arrows indicate the 11 genes showing a similar trend of FC. (C) FC between C and PFD vines at each developmental stage in Ancona and Bologna in a selection of six transcripts. (D–I) Real-time qPCR validation of the (D) ABC transporter VvPDR20-VvABCG50 (ABC; VIT_06s0061g01490), (E) Auxin response factor 10 (ARF; VIT_13s0019g04380), (F) Cinnamoyl alcohol dehydrogenase (CAD; VIT_00s0615g00020), (G) Flavonoid 3-O-glucosyltransferase (G3T; VIT_11s0052g01630), (H) Geraniol 10-hydroxylase (G10H; VIT_15s0048g01490) and (I) Indole-3-acetate beta-glucosyltransferase (IND; VIT_13s0019g03040) expression profiles in PDF and C Sangiovese vines during berry development in 2012. The mean normalized expression (MNE)-value was calculated for each sample referred to the VvUBIQUITIN1 (VIT_16s0098g01190) expression according to the Simon equation (Simon, 2003). Bars represent means ± SE of three biological replicates. The significant modulation (t-test, p < 0.05) of gene expression between C and PFD berries at each stage per each site is indicated by an asterisk, red for BO and green for AN.
FIGURE 4
FIGURE 4
Real-time qPCR analysis of PFD treatment molecular markers of Sangiovese cultivar in 2013. Real-time qPCR analysis of the (A) ABC transporter VvPDR20-VvABCG50 (ABC; VIT_06s0061g01490), (B) Auxin response factor 10 (ARF; VIT_13s0019g04380), (C) Cinnamoyl alcohol dehydrogenase (CAD; VIT_00s0615g00020), (D) Flavonoid 3-O-glucosyltransferase (G3T; VIT_11s0052g01630), (E) Geraniol 10-hydroxylase (G10H; VIT_15s0048g01490) and (F) Indole-3-acetate beta-glucosyltransferase (IND; VIT_13s0019g03040) expression profiles in PDF and C Sangiovese vines during berry development in 2013. The mean normalized expression (MNE)-value was calculated for each sample referred to the VvUBIQUITIN1 (VIT_16s0098g01190) expression according to the Simon equation (Simon, 2003). Bars represent means ± SE of three biological replicates. The significant modulation (t-test, p < 0.05) of gene expression between C and PFD berries at each stage per each site is indicated by an asterisk, red for BO and green for AN.
FIGURE 5
FIGURE 5
Real-time qPCR analysis of PFD treatment common molecular markers in 2012. Real-time qPCR analysis of the flavonol synthase (VIT_18s0001g03470) at Stage 1, jasmonate O-methyltransferase (VIT_18s0001g12890) at Stages 2 and 3 and abscisic acid receptor PYL4 (VIT_08s0058g00470) at Stage 4 of berry development from PDF and C vines of Nero d’Avola, (ND), Ortrugo (OR) and Ciliegiolo (CI) in 2012. The mean normalized expression (MNE)-value was calculated for each sample referred to the VvUBIQUITIN1 (VIT_16s0098g01190) expression according to the Simon equation (Simon, 2003). Bars represent means ± SE of three biological replicates. All genes in all genotypes resulted significantly modulated (t-test; p < 0.05) between C and PFD berries. The † indicates no significance. Heat maps reported on the left of each real-time qPCR represent the fluorescence intensity of the genes in PFD and C Sangiovese vines in Bologna (SG-BO) and Ancona (SG-AN) obtained by microarray analysis in 2012. A, B, and C correspond to the three biological replicates at each stage.
FIGURE 6
FIGURE 6
Real-time qPCR analysis of PFD treatment common molecular markers in 2013. Real-time qPCR analysis of the flavonol synthase (VIT_18s0001g03470) at Stage 1, jasmonate O-methyltransferase (VIT_18s0001g12890) at Stages 2 and 3 and abscisic acid receptor PYL4 (VIT_08s0058g00470) at Stage 4 of berry development from PDF and C vines of Sangiovese at Bologna (SG-BO) and Ancona (SG-AN) sites, Nero d’Avola, (ND), Ortrugo (OR) and Ciliegiolo (CI) in 2013. The mean normalized expression (MNE)-value was calculated for each sample referred to the VvUBIQUITIN1 (VIT_16s0098g01190) expression according to the Simon equation (Simon, 2003). Bars represent means ± SE of three biological replicates. All genes in all genotypes resulted significantly modulated (t-test; p < 0.05) between C and PFD berries. The † indicates no significance.

Similar articles

Cited by

References

    1. Agudelo-Romero P., Erban A., Sousa L., Pais M. S., Kopka J., Fortes A. M. (2013). Search for transcriptional and metabolic markers of grape pre-ripening and ripening and insights into specific aroma development in three Portuguese cultivars. PLoS ONE 8:e60422 10.1371/journal.pone.0060422 - DOI - PMC - PubMed
    1. Alagna V., Barbagallo M. G., Di Lorenzo R., Scafidi P., Pisciotta A. (2014). Effetti di differenti intensità ed epoche di defogliazione sui parametri vegeto-produttivi e sulla qualità dell’uva della cv Nero d’Avola. Acta Italus Hortus 13 168–169.
    1. Anesi A., Stocchero M., Dal Santo S., Commisso M., Zenoni S., Ceoldo S., et al. (2015). Towards a scientific interpretation of the terroir concept: plasticity of the grape berry metabolome. BMC Plant Biol. 15:191 10.1186/S12870-015-0584-4 - DOI - PMC - PubMed
    1. Baggiolini M. (1952). Les stades repère dans le développement annuel de la vigne et leur utilization pratique. Rev. Rom. Agric. Vitic. Arb. 8 4–6.
    1. Boneh U., Biton I., Zheng C. L., Schwartz A., Ben-Ari G. (2012). Characterization of potential ABA receptors in Vitis vinifera. Plant Cell Rep. 31 311–321. 10.1007/s00299-011-1166-z - DOI - PubMed