

Serum Neurofilament light: A biomarker of neuronal damage in multiple sclerosis
- PMID: 28512753
- PMCID: PMC5519945
- DOI: 10.1002/ana.24954
Serum Neurofilament light: A biomarker of neuronal damage in multiple sclerosis
Abstract
Objective: Neurofilament light chains (NfL) are unique to neuronal cells, are shed to the cerebrospinal fluid (CSF), and are detectable at low concentrations in peripheral blood. Various diseases causing neuronal damage have resulted in elevated CSF concentrations. We explored the value of an ultrasensitive single-molecule array (Simoa) serum NfL (sNfL) assay in multiple sclerosis (MS).
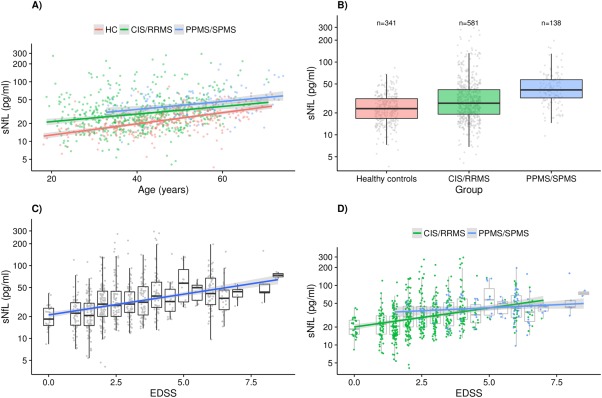
Methods: sNfL levels were measured in healthy controls (HC, n = 254) and two independent MS cohorts: (1) cross-sectional with paired serum and CSF samples (n = 142), and (2) longitudinal with repeated serum sampling (n = 246, median follow-up = 3.1 years, interquartile range [IQR] = 2.0-4.0). We assessed their relation to concurrent clinical, imaging, and treatment parameters and to future clinical outcomes.
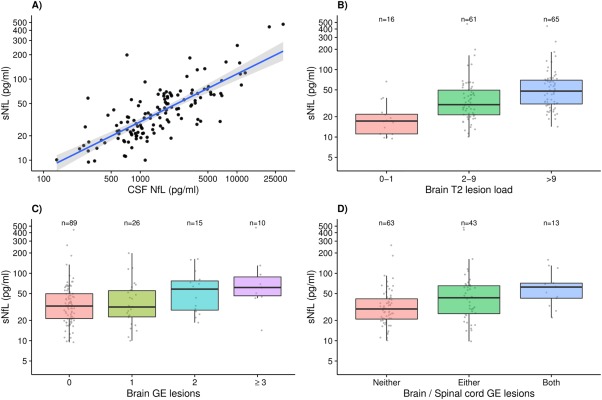
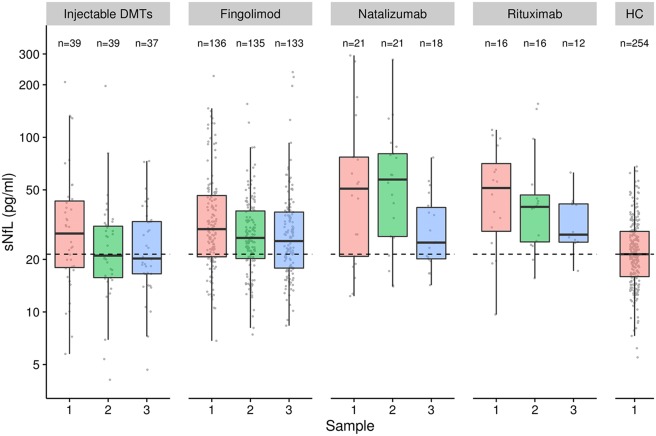
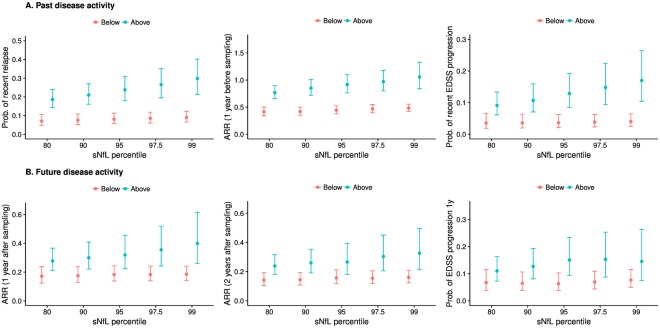
Results: sNfL levels were higher in both MS cohorts than in HC (p < 0.001). We found a strong association between CSF NfL and sNfL (β = 0.589, p < 0.001). Patients with either brain or spinal (43.4pg/ml, IQR = 25.2-65.3) or both brain and spinal gadolinium-enhancing lesions (62.5pg/ml, IQR = 42.7-71.4) had higher sNfL than those without (29.6pg/ml, IQR = 20.9-41.8; β = 1.461, p = 0.005 and β = 1.902, p = 0.002, respectively). sNfL was independently associated with Expanded Disability Status Scale (EDSS) assessments (β = 1.105, p < 0.001) and presence of relapses (β = 1.430, p < 0.001). sNfL levels were lower under disease-modifying treatment (β = 0.818, p = 0.003). Patients with sNfL levels above the 80th, 90th, 95th, 97.5th, and 99th HC-based percentiles had higher risk of relapses (97.5th percentile: incidence rate ratio = 1.94, 95% confidence interval [CI] = 1.21-3.10, p = 0.006) and EDSS worsening (97.5th percentile: OR = 2.41, 95% CI = 1.07-5.42, p = 0.034).
Interpretation: These results support the value of sNfL as a sensitive and clinically meaningful blood biomarker to monitor tissue damage and the effects of therapies in MS. Ann Neurol 2017;81:857-870.
© 2017 The Authors. Annals of Neurology published by Wiley Periodicals, Inc. on behalf of American Neurological Association.
Figures
References
-
- Friese MA, Schattling B, Fugger L. Mechanisms of neurodegeneration and axonal dysfunction in multiple sclerosis. Nat Rev Neurol 2014;10:225–238. - PubMed
-
- Comabella M, Montalban X. Body fluid biomarkers in multiple sclerosis. Lancet Neurol 2014;13:113–126. - PubMed
-
- Teunissen CE, Khalil M. Neurofilaments as biomarkers in multiple sclerosis. Mult Scler 2012;18:552–556. - PubMed
-
- Malmestrom C, Haghighi S, Rosengren L, et al. Neurofilament light protein and glial fibrillary acidic protein as biological markers in MS. Neurology 2003;61:1720–1725. - PubMed
-
- Norgren N, Rosengren L, Stigbrand T. Elevated neurofilament levels in neurological diseases. Brain Res 2003;987:25–31. - PubMed
Publication types
MeSH terms
Substances
LinkOut - more resources
Full Text Sources
Other Literature Sources
Medical
