Deconstructing white matter connectivity of human amygdala nuclei with thalamus and cortex subdivisions in vivo
- PMID: 28512761
- PMCID: PMC5729634
- DOI: 10.1002/hbm.23639
Deconstructing white matter connectivity of human amygdala nuclei with thalamus and cortex subdivisions in vivo
Abstract
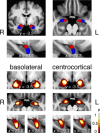
Structural alterations in long-range amygdala connections are proposed to crucially underlie several neuropsychiatric disorders. While progress has been made in elucidating the function of these connections, our understanding of their structure in humans remains sparse and non-systematic. Harnessing diffusion-weighted imaging and probabilistic tractography in humans, we investigate connections between two main amygdala nucleus groups, thalamic nuclei, and cortex. We first parcellated amygdala into deep (basolateral) and superficial (centrocortical) nucleus groups, and thalamus into six subregions, using previously established protocols based on connectivity. Cortex was parcellated based on T1-weighted images. We found substantial amygdala connections to thalamus, with different patterns for the two amygdala nuclei. Crucially, we describe direct subcortical connections between amygdala and paraventricular thalamus. Different from rodents but similar to non-human primates, these are more pronounced for basolateral than centrocortical amygdala. Substantial white-matter connectivity between amygdala and visual pulvinar is also more pronounced for basolateral amygdala. Furthermore, we establish detailed connectivity profiles for basolateral and centrocortical amygdala to cortical regions. These exhibit cascadic connections with sensory cortices as suggested previously based on tracer methods in non-human animals. We propose that the quantitative connectivity profiles provided here may guide future work on normal and pathological function of human amygdala. Hum Brain Mapp 38:3927-3940, 2017. © 2017 Wiley Periodicals, Inc.
Keywords: DWI; connectome; neuroanatomy; paraventricular; probabilistic tractography; structural connectivity.
© 2017 The Authors Human Brain Mapping Published by Wiley Periodicals, Inc.
Figures


References
-
- Aggleton JP, Mishkin M (1984): Projections of the amygdala to the thalamus in the cynomolgus monkey. J Comp Neurol 222:56–68. - PubMed
-
- Aggleton JP, Burton MJ, Passingham RE (1980): Cortical and subcortical afferents to the amygdala of the rhesus monkey (Macaca mulatta). Brain Res 190:347–368. - PubMed
-
- Amaral DG, Price JL (1984): Amygdalo‐cortical projections in the monkey (Macaca fascicularis). J Comp Neurol 230:465–496. - PubMed
Publication types
MeSH terms
Grants and funding
LinkOut - more resources
Full Text Sources
Other Literature Sources

