. 2017 Aug;6(16):1700383.
doi: 10.1002/adhm.201700383. Epub 2017 May 17.

Peptide-Functionalized Fluorescent Particles for In Situ Detection of Nitric Oxide via Peroxynitrite-Mediated Nitration

Affiliations

Peptide-Functionalized Fluorescent Particles for In Situ Detection of Nitric Oxide via Peroxynitrite-Mediated Nitration

Jason Y H Chang et al. Adv Healthc Mater. 2017 Aug.

Abstract

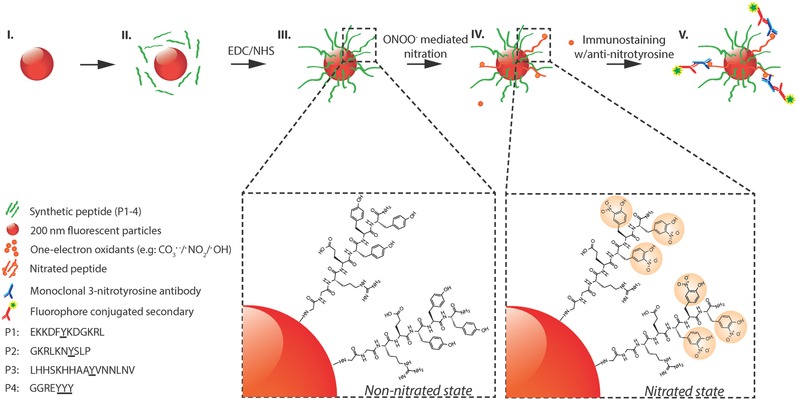
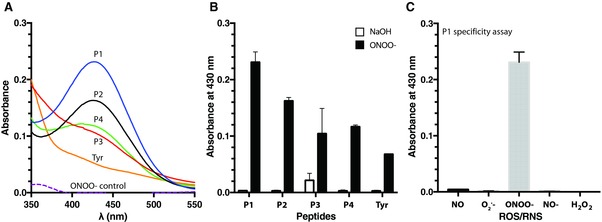
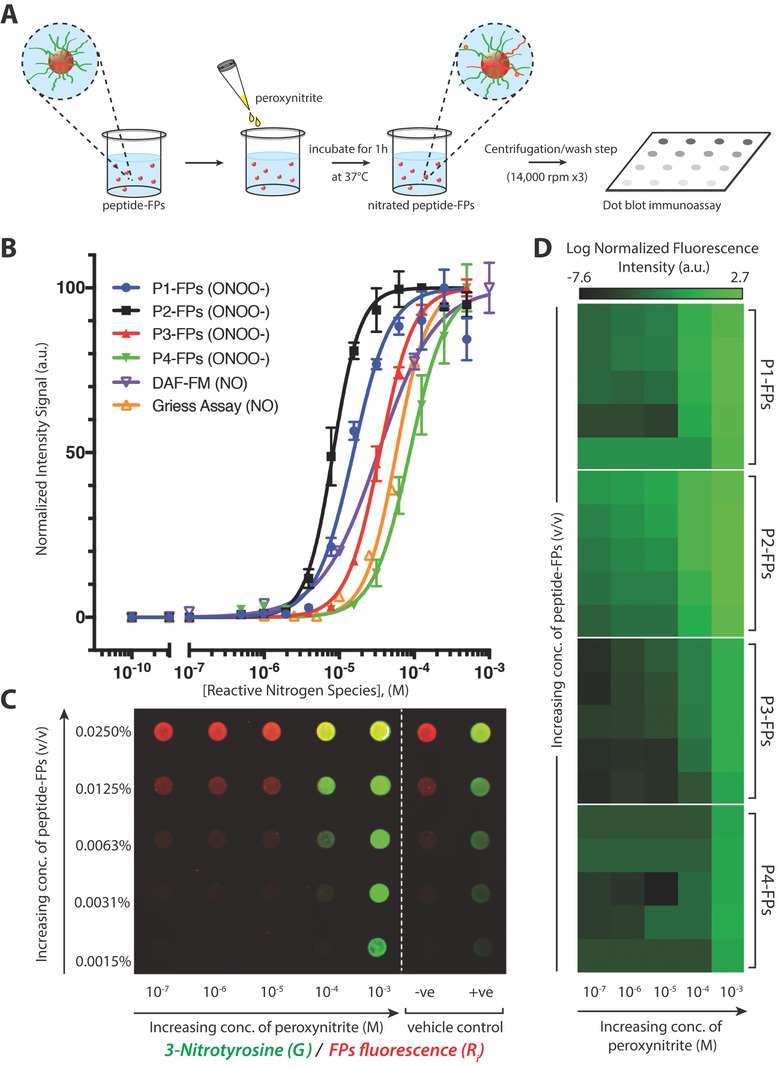
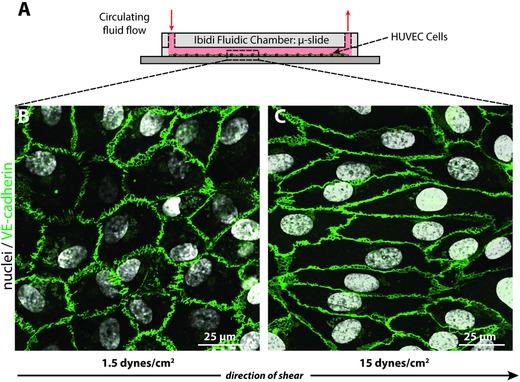
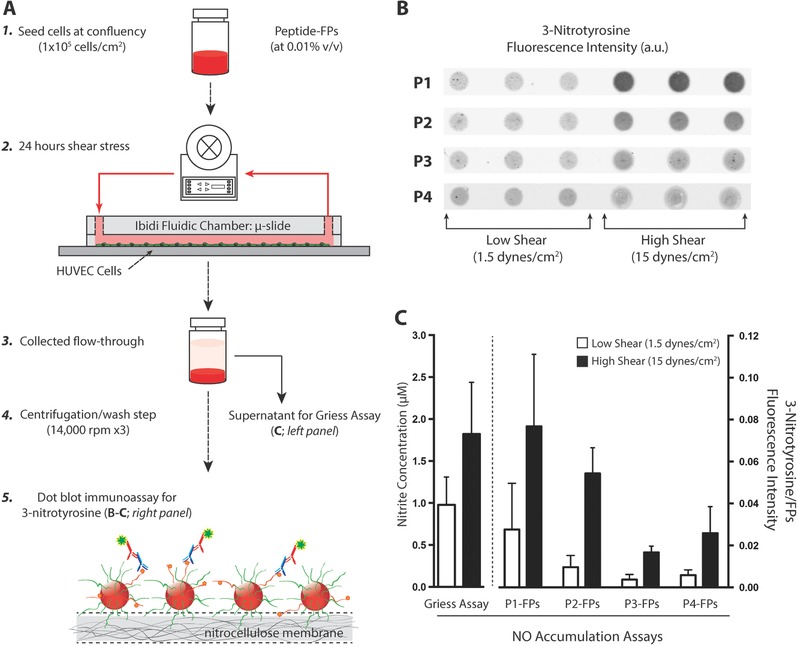
Nitric oxide (NO) is a free radical signaling molecule that plays a crucial role in modulating physiological homeostasis across multiple biological systems. NO dysregulation is linked to the pathogenesis of multiple diseases; therefore, its quantification is important for understanding pathophysiological processes. The detection of NO is challenging, typically limited by its reactive nature and short half-life. Additionally, the presence of interfering analytes and accessibility to biological fluids in the native tissues make the measurement technically challenging and often unreliable. Here, a bio-inspired peptide-based NO sensor is developed, which detects NO-derived oxidants, predominately peroxynitrite-mediated nitration of tyrosine residues. It is demonstrated that these peptide-based NO sensors can detect peroxynitrite-mediated nitration in response to physiological shear stress by endothelial cells in vitro. Using the peptide-conjugated fluorescent particle immunoassay, peroxynitrite-mediated nitration activity with a detection limit of ≈100 × 10-9 m is detected. This study envisions that the NO detection platform can be applied to a multitude of applications including monitoring of NO activity in healthy and diseased tissues, localized detection of NO production of specific cells, and cell-based/therapeutic screening of peroxynitrite levels to monitor pronitroxidative stress in biological samples.

Keywords: endothelial cells; immunoassays; nitric oxide detection; peptide biosensors; peroxynitrite.


Figures

Figure 1
Figure 1
Schematic representation of peroxynitrite‐induced nitration. (I) The fluorescent particle, (II) conjugation of peptides with EDC/NHS cross‐linker (P1–P4), (III) non‐nitrated peptides conjugated to surface of fluorescent particles, (IV) nitration of tyrosine through peroxynitrite‐mediated pathway, (V) immunostaining of nitrated peptides with anti‐nitrotyrosine IgGs and fluorescent secondary IgGs. (Steps I–III): Carboxyl‐functionalized red fluorescent particles (≈200 nm in size) are coated with tyrosine‐containing peptides (P1–P4, green strands). Step IV: Peroxynitrite‐mediated nitration of tyrosine residues resulting in the formation of 3‐nitrotyrosine. Step V: Immunostaining of nitrated peptides with monoclonal anti‐nitrotyrosine IgGs (MAB5404; Millipore) and fluorophore‐conjugated secondary IgGs.
Figure 2
Figure 2
3‐Nitrotyrosine detection with UV–vis spectrophotometry. A) Representative spectra of 3‐nitrotyrosine detection for each peptide. Peptides (P1–P4; 1 × 10⁻³ m) and l‐tyrosine (Tyr; 1 × 10⁻³ m) were exposed to peroxynitrite (0.5 × 10⁻³ m) in phosphate buffered saline (pH 7.4) for 1 h at 37 °C; nitration yields were determined with UV–vis. The presence of 3‐nitrotyrosine in P1 (solid blue line), P2 (solid black line), P3 (solid red line), P4 (solid green line), and Tyr (solid orange line) was shown as an increase in absorbance at 430 nm, where it was compared to peroxynitrite alone (ONOO; dashed purple line). B) Average 3‐nitrotyrosine signal for peroxynitrite‐treated peptides (black bars; N = 3) compared to vehicle‐treated control peptides (white bars; N = 3). 3‐Nitrotyrosine yields were measured at 430 nm using UV–vis spectrophotometry. C) Representative peptide (P1) specificity assay treated with various reactive oxygen and nitrogen species (ROS/RNS; 0.5 × 10⁻³ m). Absorbance values detected at 430 nm (N = 3). Vehicle control = 0.3 m NaOH. Error bars represent SD.
Figure 3
Figure 3
Representative immunoassay of peroxynitrite‐induced nitration of fluorescent particle complexes. A) Schematic representation of peptide–FP complexes treated with peroxynitrite in a 96‐well plate and incubated at 37 °C for 1 h, followed by centrifugation/wash step (at 14,000 rpm for 10 min, for three times) and dot blotted onto a nitrocellulose membrane. B) Comparison of normalized dose–response curves of each peptide–FP complex against the DAF‐FM probe and Griess assay as a function of increasing concentration of reactive nitrogen species (either NO or ONOO). Peptide–FPs were treated with peroxynitrite (500 × 10−9 m to 500 × 10−6 m), while the DAF‐FM and Griess assay were used to detect NO/NO2 . Peptide–FPs were loaded at 0.01% (v/v) concentration (N = 2). C) Representative immunoarray of 3‐nitrotyrosine detection sensitivity as a function of concentration of peptide–FPs or peroxynitrite (representative immunoarray of P1‐FPs). Fluorescent particles are shown in red; anti‐nitrotyrosine immunofluorescence signal is shown in green; vehicle‐treated controls: [sodium hydroxide (0.3 m NaOH; −ve); 3‐nitrotyrosine‐conjugated fluorescent particles (+ve)]. Fluorescence was detected with a two‐channel infra‐red scanner (Odyssey; Licor). D) Averaged fluorescence intensity of 3‐nitrotyrosine detection as a function of peptide–FPs concentration (y‐axis; same concentrations as panel C) or peroxynitrite concentration (x‐axis) presented in a heat map (N = 3). Each dot blot fluorescence signal was normalized against the particle's autofluorescence to account for variations of fluorescent particle concentration. Normalized fluorescence intensity is shown on a log‐scale to show the sensitivity of the 3‐nitrotyrosine antibody signal.
Figure 4
Figure 4
HUVECs exposed to different levels of shear stress. A) HUVECs were sheared under low and high shear stress for 24 h with peptide–FPs circulating in the culture media. B) HUVECs at low shear (1.5 dynes cm−2) exhibited the characteristic cobblestone morphology, C) while HUVECs exposed to high shear (15 dynes cm−2) showed elongated cell shapes aligned with the direction of flow. Cells were stained for nuclei (DAPI; white) and junctional proteins as an indication of cell monolayer confluency (VE‐cadherin; green), which localized to cell borders. The arrow indicates the direction of laminar flow applied to the cells.
Figure 5
Figure 5
3‐Nitrotyrosine detection of cells under shear stress. A) Schematic representation of HUVECs cultured under low and high shear with the presence of circulating peptide–FP complex to detect NO production. Step 1: Cells were seeded at confluency (1 × 10⁵ cells cm−2) and allowed to acclimate overnight (18–24 h). Step 2: Each µ‐slide was loaded with peptide–FP complex (at 0.01% v/v) at the start of the shear experiments. Steps 3–4: After 24 h of shear stress, both media and fluorescent particles were collected and pelleted. Step 5: Peptide–FPs were washed and analyzed for 3‐nitrotyrosine formation (panel B). The collected medium was stored for nitrite detection (by Griess assay). B) Representative dot‐blot immunoassay comparing the amount of 3‐nitrotyrosine binding for each peptide–FP complex (P1–P4) under either low or high shear stress. For each peptide–FP complex, six individual experiments were conducted, each with triplicate measures per experimental condition. C) Comparison of NO accumulation assays. (Left) Griess reagent assay detection for nitrite concentration. Nitrite release (24 h – accumulation) was assayed from the supernatant of each sheared experiment. Data show the averaged nitrite release from HUVECs between low versus high shear (N = 22 vs 24; p < 0.01). (Right) Averaged 3‐nitrotyrosine signal for each peptide–FP complex normalized against particles autofluorescence to account for loading differences. Data are expressed as mean ± SD for all shear experiments (N = 6) except for P1‐FPs and P2‐FPs at low shear with only N = 5 each. Error bars represent SD.

References

    1. Walford G., Loscalzo J., J. Thromb. Haemostasis 2003, 1, 2112. - PubMed
    1. Moncada S., Higgs A., N. Engl. J. Med. 1993, 329, 2002. - PubMed
    1. Moncada S., Ann. N. Y. Acad. Sci. 1997, 811, 60. - PubMed
    1. Moncada S., Palmer R. M., Higgs E. A., Pharmacol. Rev. 1991, 43, 109. - PubMed
    1. Kapadia M. R., Chow L. W., Tsihlis N. D., Ahanchi S. S., Eng J. W., Murar J., Martinez J., Popowich D. A., Jiang Q., Hrabie J. A., Saavedra J. E., Keefer L. K., Hulvat J. F., Stupp S. I., Kibbe M. R., J. Vasc. Surg. 2008, 47, 173. - PMC - PubMed